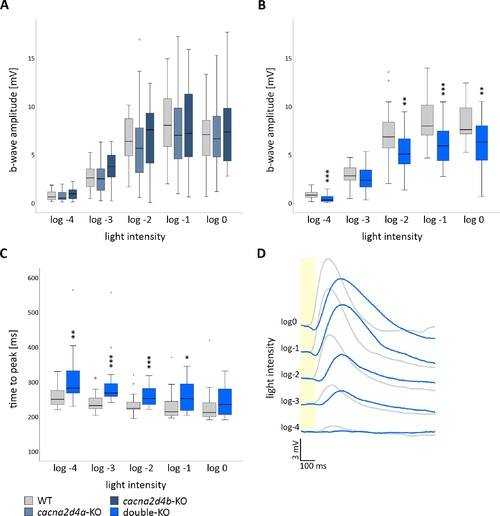
Retinal function of cacna2d4-KO lines at 5 dpf. (A–C) Box and whisker plots of white-light ERG b-wave amplitudes or b-wave kinetics of 5 dpf WT, cacna2d4a-KO, cacna2d4b-KO and double-KO. Bottom and top of the box, the first and third quartile; median, line within the box; whiskers, minimum and maximum values; circles, outliers (1.5 × interquartile distance); small asterisks, extreme outliers (3 × interquartile distance). Five flashes (100 ms) of increasing light intensities were applied, starting from dim light (log-4) to 100% light intensity (log0, 24,000 μW/cm), and responses were grouped accordingly. (A) Neither cacna2d4a nor cacna2d4b-KO disturbed the ERG response at any light intensity (n = 27 per genotype). (B) KO of both paralogs significantly reduced the b-wave amplitude at different light intensities (n = 25 per genotype). (C) The time from baseline to peak is significantly prolonged in double-KO retinae. Significance levels: *P ≤ 0.05, **P ≤ 0.01, ***P ≤ 0.001. (D) Example traces of WT (gray) and double-KO (blue). Yellow bar in (D) represents the stimulus.
|
