|
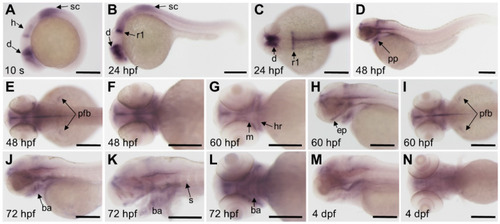
Expression patterns of fgfr3 detected by whole mount in situ hybridization in wild-type zebrafish. (A) Lateral view of 10-somite stage; (B-C) show 24 hpf embryo in lateral view (B) and head region in dorsal view (C). (D-F) show 48 hpf embryo in lateral view (D) and head region in dorsal view (E) and in ventral view (F). (G-I) show head region of 60 hpf embryo in ventral view (G), in lateral view (H) and in dorsal view (I). (J-L) show head region of 72 hpf embryo in lateral view with yolk (J) and in lateral view without yolk (K), 72 hpf embryo in ventral view (L); (M-N) show head region of 4 dpf embryo in lateral view (M) and in ventral view (N). n = 30 embryos for A-N. Abbreviations: ba, branchial arch; d, diencephalon; ep, ethmoid plate; h, hindbrain; ha, hyoid arch; m, mandibular arch; pfb, pectoral fin bud; pp, pharyngeal pouches; r1, rhombomere 1; s, somites; sc, spinal cord. Scale bars: 200 µm in A-N.
|