
Fig. S50
- ID
- ZDB-FIG-200623-5
- Publication
- Oliveira et al., 2020 - Platinum-triggered Bond-cleavage of Pentynoyl amide and N-propargyl handles for Drug-Activation
- Other Figures
- All Figure Page
- Back to All Figure Page
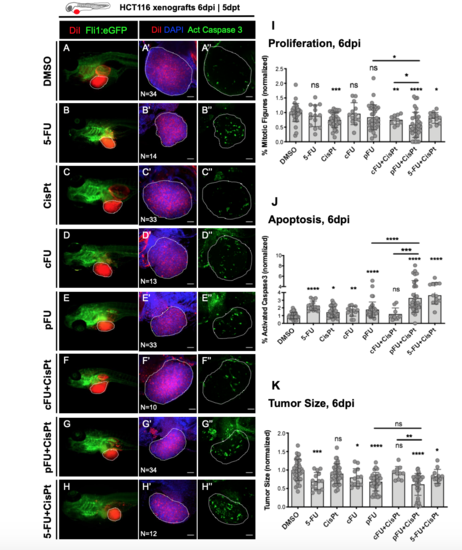
Cisplatin-mediated prodrug decaging in a colon cancer Zebrafish Xenograft model at 6dpi. HCT116 human CRC cells were fluorescently labelled with lipophilic dye CM-DiI (shown in red) and injected into the PVS of 2 dpf Tg(Fli1:eGFP) zebrafish larvae. Zebrafish xenografts were treated in vivo for 5 consecutive days with: DMSO, 5-FU, CisPt, cFU, pFU, cFU+CispPt, pFU+CisPt and 5-FU+CisPt. At 6dpi (5dpt), zebrafish xenografts were imaged by stereoscope (A-H) and by confocal microscopy (A’-H’ DAPI plus DiI; A’’-H’’ a maximum projection of activated caspase 3). Quantification of proliferation (mitotic figures, I *** P=0.0004, ** P=0.0012, **** P<0.0001, * P=0.0106, * pFU vs pFU+CisPt P=0.0104, * cFU+CisPt vs pFU+CisPt P=0.0470), apoptosis (activated caspase3, J ****P<0.0001, * P=0.0126, ** P=0.0084, *** P=0.0002) and tumor size (no of tumor cells, K *** P=0.0008, * cFU P=0.0216, **** P<0.0001, * 5-FU+CisPt P=0.0273, ** P=0.0017). Outcomes are expressed by fold induction (normalized values to controls) as AVG ± SEM. The number of xenografts analyzed is indicated in the representative images and each dot represents one zebrafish xenograft. Statistical analysis was performed using an unpaired t-test. Statistical results: ns>0.05, *P≤0.05, **P≤0.01, ***P≤0.001 and ****P≤0.0001. All images are anterior to the left, posterior to right, dorsal up, and ventral down. Scale bar 50 μm. |