
FIGURE
Fig. 5
- ID
- ZDB-FIG-200610-35
- Publication
- Gong et al., 2020 - Exploration of anti-inflammatory mechanism of forsythiaside A and forsythiaside B in CuSO4-induced inflammation in zebrafish by metabolomic and proteomic analyses
- Other Figures
- All Figure Page
- Back to All Figure Page
Fig. 5
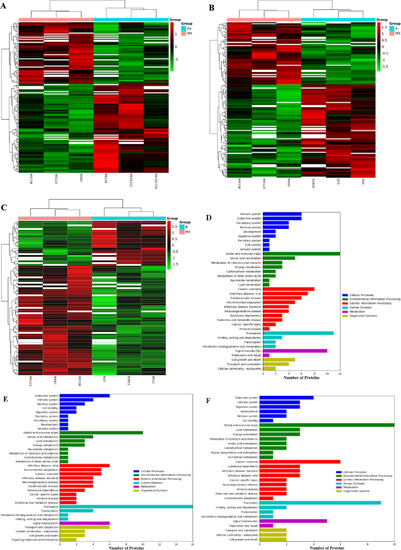
Proteomic analyses of zebrafish larvae samples from the control, model, FA, and FB groups. Heat-map of differential proteins of control vs. model ( |
Expression Data
Expression Detail
Antibody Labeling
Phenotype Data
Phenotype Detail
Acknowledgments
This image is the copyrighted work of the attributed author or publisher, and
ZFIN has permission only to display this image to its users.
Additional permissions should be obtained from the applicable author or publisher of the image.
Full text @ J Neuroinflammation