|
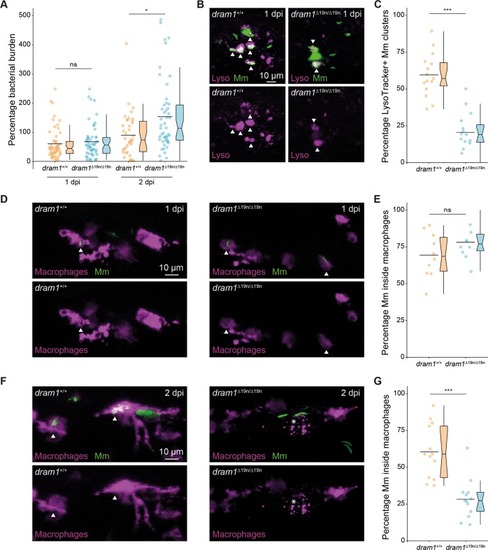
Macrophages fail to restrict Mm infection in Dram1-deficient larvae.a Mm bacterial burden for dram1∆19n/∆19n and dram1+/+ at 1 and 2 dpi. Data are accumulated from two independent experiments (>38 larvae/group) and represented by scatter and boxplots as detailed in the “Methods” section. b Representative confocal images of LysoTracker staining performed on infected dram1∆19n/∆19n and dram1+/+ embryos at 1 dpi. The arrowheads indicate Lysotracker-positive (LysoTracker+) Mm clusters. Scale bars, 10 μm. c The percentage of LysoTracker+ Mm clusters was determined in infected embryos (≥15 embryos/group) at 1 dpi. The percentage of Mm clusters positive for LysoTracker staining (LysoTracker+) was determined per individual infected larva. Data are accumulated from two independent experiments and represented by scatter and boxplots as detailed in the “Methods” section. ns non-significant, *p < 0.05,**p < 0.01,***p < 0.001. d and f Representative confocal images of infected dram1∆19n/∆19n and dram1+/+ embryos/larvae in mpeg1:mCherryF background at 1 dpi d and 2 dpi f. The entire CHT region of fixed embryos or larvae was imaged. The arrowheads indicate intracellular Mm clusters and an asterisk (*) indicates remnants from dead macrophages. Scale bars, 10 μm. e and g Percentage of Mm clusters restricted inside macrophages at 1 dpi e and 2 dpi g (≥10 embryos/group). The percentage of intracellular Mm clusters was determined per individual embryo. Data are accumulated from two independent experiments and represented by scatter and boxplots as detailed in the “Methods” section. ns non-significant, *p < 0.05,**p < 0.01,***p < 0.001.
|