
Figure 2
- ID
- ZDB-FIG-200406-2
- Publication
- Yang et al., 2020 - Aberrant expression of miR-29b-3p influences heart development and cardiomyocyte proliferation by targeting NOTCH2
- Other Figures
- All Figure Page
- Back to All Figure Page
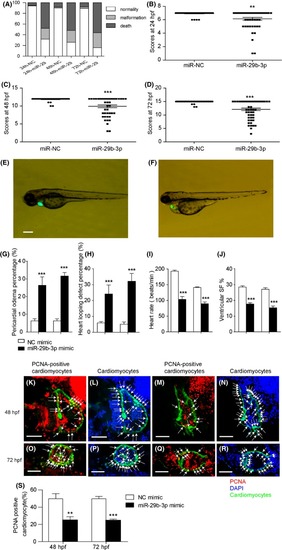
MiR‐29b‐3p injection disturbed the development of zebrafish heart. A, MiR‐29b‐3p injection led to a higher mortality and malformation rate in zebrafish embryos from 24 to 72 hpf (n > 100). B‐D, The general morphology score system was used to evaluate the development of zebrafish embryos. MiR‐29b‐3p injection induced a developmental delay in zebrafish embryos at 24, 48 and 72 hpf (n > 50). E, Normal heart morphology of 72 hpf zebrafish embryos injected with miR‐NC mimic. F, Abnormal heart morphology of 72 hpf zebrafish embryos injected with miR‐29b‐3p mimic, including pericardial oedema and looping defects. Cardiac visualization under bright‐field microscopy, with the photographs showing heart morphology (bar = 100 µm). G and H, MiR‐29b‐3p injection caused a higher degree of pericardial oedema and looping defects in zebrafish embryos (n > 50). I and J, MiR‐29b‐3p injection induced a decrease in heart rate and ventricular shortening fraction (n > 50). K‐N, PCNA in the hearts of zebrafish embryos injected with NC mimic (K, L) or miR‐29b‐3p mimic (M, N) at 48 hpf. O‐R, PCNA in the hearts of zebrafish embryos injected with NC mimic (O, P) or miR‐29b‐3p mimic (Q, R) at 72 hpf. Arrows indicated PCNA‐positive cardiomyocytes (K, M, O, Q) and the nuclei of cardiomyocytes (L, N, P, R). The proliferation index was calculated by dividing the number of PCNA‐positive cardiomyocytes by the total number of cardiomyocytes at the largest anatomical level of the ventricle. Cmlc2‐positive (green) staining indicated cardiomyocytes, nuclei were labelled with DAPI (blue), and PCNA‐positive (red) staining indicated proliferative cells (bar = 50 µm). S, Quantitative assessment of the proliferation index of PCNA‐positive cardiomyocytes (n = 5‐7). The data are presented as the mean ± SEM. Statistical significance is shown as * |