
Fig. 1
- ID
- ZDB-FIG-200331-8
- Publication
- Johnson et al., 2019 - Probabilistic Models of Larval Zebrafish Behavior Reveal Structure on Many Scales
- Other Figures
- All Figure Page
- Back to All Figure Page
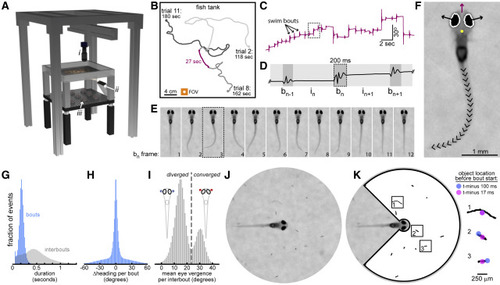
Acquiring Behavioral Data with BEAST (A) BEAST schematic. Infrared camera (i) moves on motorized gantry to stay above fish. Frame rate = 60 fps. Projector (ii) and IR-LEDs (iii) illuminate screen embedded in tank bottom. See Video S1 for animated schematic. (B) Swim paths from three trials from one fish. Arena water volume = 300 × 300 × 4 mm. Camera field of view = 22 × 22 mm (orange square). (C) Fish heading direction over time (from purple section in B). (D) Expansion of box from (C) with bout and interbout epochs identified (notation indicated). (E) One swim bout (from box in D) after image registration. (F) Head position (yellow dot), heading direction (purple arrow), eye vergence angles (angles of black arrows above horizontal), and tail shape (20 tail tangent directions) extracted in every frame (frame 3 from E shown). See Figure S1 for details. (G) Histograms of all bout and interbout durations. (H) Histogram of heading direction change per bout (heading). (I) Histogram of mean eye vergence per interbout. Convergence threshold set at local minimum: 24°. (J) Video dataset cropped to circular FOV (diameter = 8.12 mm). (K) Locations, sizes, shapes, and relative velocities of putative prey are identified preceding initiation of every swim bout (here shown for objects in J). Box width = 820 μm. Identified objects are mostly edible (paramecia, rotifers), but include also algae, dust (box 1), and artifacts. |