
FIGURE
Fig. 6
- ID
- ZDB-FIG-200325-8
- Publication
- Franke et al., 2019 - An arbitrary-spectrum spatial visual stimulator for vision research
- Other Figures
- All Figure Page
- Back to All Figure Page
Fig. 6
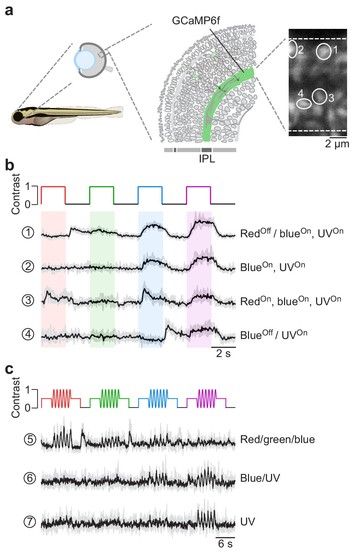
Chromatic responses in bipolar cells of in vivo zebrafish larvae.( a) Drawing illustrating the expression of the genetically encoded Ca2+ biosensor SyGCaMP6f in bipolar cell terminals (left) of tg(1.8ctbp2:SyGCaMP6f) zebrafish larvae and scan field of inner plexiform layer (IPL; right), with exemplary regions-of-interest (ROIs) marked by white circles. ( b) Mean Ca2+ traces (black; n = 6 trials in grey) in response to red, green, blue and UV full-field flashes (90 × 120 degrees visual angle, presented to the fish’s right side). ( c) Mean Ca2+ traces (black; n = 4 trials in grey) in response to full-field sine modulation (at 1 Hz) of red, green, blue and UV LED. |
Expression Data
Expression Detail
Antibody Labeling
Phenotype Data
Phenotype Detail
Acknowledgments
This image is the copyrighted work of the attributed author or publisher, and
ZFIN has permission only to display this image to its users.
Additional permissions should be obtained from the applicable author or publisher of the image.
Full text @ Elife