FIGURE

Fig. 7

ID
ZDB-FIG-200311-9
Publication
Farkas et al., 2019 - Discovering the chloride pathway in the CFTR channel
Other Figures
All Figure Page
Back to All Figure Page
Fig. 7

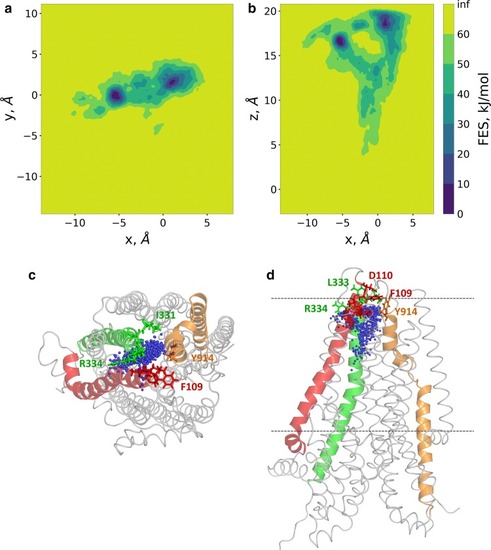
Two routes towards the extracellular regions were detected by metadyanamics simulations. Well-tempered metadynamics simulations were performed to identify potential exit routes of chloride ions and the amino acids narrowing this region of the pathway. The distance between the center of mass of four Cα atoms (a.a. 95, 347, 924, and 1141) and Cl #2 was used as a reaction coordinate (collective variable, CV). 2D free energy surfaces were calculated along the x, y, and z components of this distance CV and plotted (panels a, b). Top (panel c) and side (panel d) views of chloride ions from every 100th frames are shown by blue spheres in relation to the initial structure. TM1, TM6, and TM8 are colored by red, green, and orange, respectively. Sticks represent the following amino acids in the bottleneck region: I106, A107, Y109 (F in zCFTR), D110 (TM1), I331, I332 (N in zCFTR), L333, R334 (TM6), Y914 (TM8)

Expression Data

Expression Detail
Antibody Labeling
Phenotype Data

Phenotype Detail
Acknowledgments
This image is the copyrighted work of the attributed author or publisher, and ZFIN has permission only to display this image to its users. Additional permissions should be obtained from the applicable author or publisher of the image. Full text @ Cell. Mol. Life Sci.