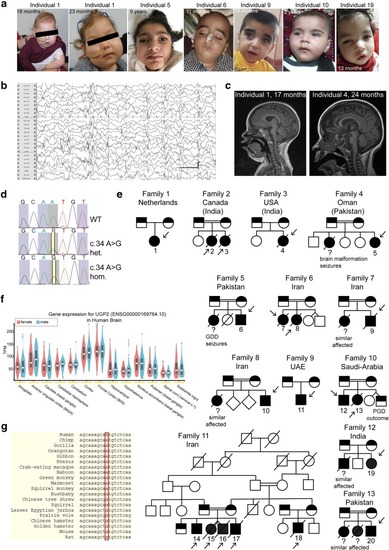
UGP2 homozygous variants in 20 individuals with severe epileptic encephalopathy. a Facial pictures of individual 1 (at 18 and 23 months), individual 5 (at 9 years), individual 6 (at 11 months), individual 9 (at 18 months), individual 10 (at 2 years) and individual 19 (at 13 months). Note the progressive microcephaly with sloping forehead, suture ridging, bitemporal narrowing, high hairline, arched eyebrows, pronounced philtrum, a relatively small mouth and large ears. b Electroencephalogram of individual 1 at the age of 8 months showing a highly disorganized pattern with high-voltage irregular slow waves intermixed with multifocal spikes and polyspikes. c T1-weighted mid-sagittal brain MRI of individual 1 (at 17 months) and individual 4 (at 24 months) illustrating global atrophy and microcephaly but no major structural anomalies. d Sanger sequencing traces of family 1, confirming the chr2:64083454A>G variant in UGP2 in heterozygous and homozygous states in parents and affected individual 1, respectively. e Family pedigrees of ascertained patients. Affected individuals and heterozygous parents are indicated in black and half black, respectively. Affected individuals with confirmed genotype are indicated with an arrow, and numbers. Other not-tested affected siblings presenting with similar phenotypes are indicated with a question mark. Consanguineous parents are indicated with a double connection line. Males are squares, females are circles; unknown sex is indicated with rotated squares; deceased individuals are marked with a line. f Violin plots showing distribution of gene expression (in TPM) amongst male and female samples from the GTEx portal for various brain regions. Outliers are indicated by dots. g Multiple species sequence alignment from the UCSC browser, showing that the ATG start site is highly conserved
|
