|
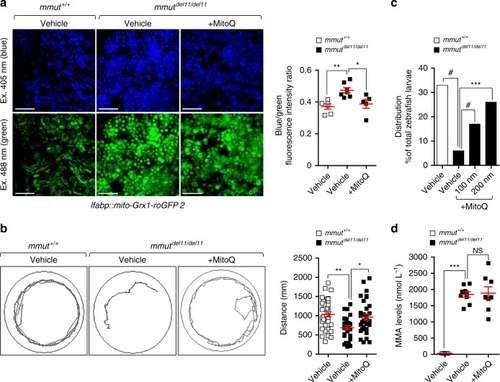
Mitochondria-targeted ROS scavenger MitoQ rescues the MMA–associated phenotypes in <italic>mmut</italic>–deficient zebrafish.a–d Zebrafish larvae were treated with vehicle or with the mitochondria-targeted ROS scavenger MitoQ (100 nM or 200 nM, respectively, for 24 h). a Representative images and quantification of ratio between 405 (blue) and 488 (green) fluorescence intensities in mmut zebrafish expressing mito-Grx1-roGFP2 in the liver. Each point represents the average fluorescence intensity ratio in an individual zebrafish liver; n = 6 vehicle-treated mmut+/+ zebrafish and n = 7 vehicle-treated mmutdel11/del11 zebrafish, and n = 5 MitoQ-treated mmutdel11/del11 zebrafish larvae. Kruskal‒Wallis followed by Dunn’s multiple comparison test, *P < 0.05 and **P < 0.01 relative to vehicle-treated mmut+/+ or vehicle-treated mmutdel11/del11 zebrafish larvae. b Tracking analyses of motor behaviour in 10-dpf-mmut zebrafish larvae. Quantification of distance, with each point representing the average distance covered by an individual zebrafish; n = 28 vehicle-treated mmut+/+, n = 27 vehicle-treated mmutdel11/del11 and n = 31 MitoQ-treated mmutdel11/del11 zebrafish larvae. One-way ANOVA followed by Bonferroni’s post hoc test, *P < 0.05 and **P < 0.01 relative to vehicle-treated mmut+/+ or to vehicle-treated mmutdel11/del11 zebrafish larvae. c Distribution of mmut zebrafish larvae (expressed as the percentage of total larvae) after treatment with either vehicle or MitoQ. Values are from one biological repeat, with n ≥ 77mmut zebrafish larvae per each group/condition. Chi-square goodness of fit test, ***P < 0.001 and #P < 0.0001 relative to vehicle-treated mmut+/+ or mmutdel11/del11 zebrafish larvae. d Quantification of MMA levels by LC-MS/MS; n = 5 vehicle-treated mmut+/+, n = 9 vehicle-treated mmutdel11/del11 and n = 8 MitoQ-treated mmutdel11/del11 zebrafish larvae. Plots represent mean ± SEM. Kruskal–Wallis followed by Dunn’s multiple comparison test, **P < 0.01 relative to vehicle-treated mmut+/+ or vehicle-treated mmutdel11/del11 zebrafish larvae. Scale bars, 100 μm. NS non-significant. Source data are provided as a Source Data file.
|