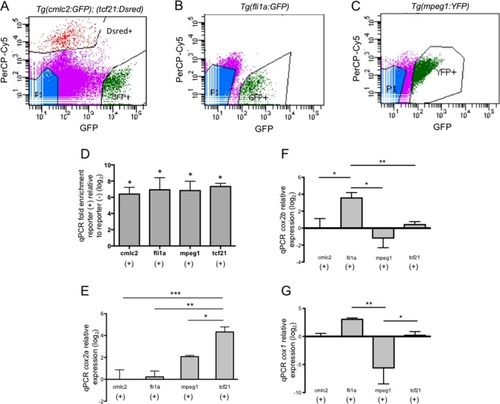
Cox2a expression is highest in epicardial cells at 3 dpa. (A–C) Representative FACS dot plots displaying gating parameters used to isolate cells from (A) Tg(cmlc2:EGFP); Tg(tcf21:DsRed), (B) Tg(fli1a:eGFP), (C) Tg(mpeg1:YFP) reporter lines at 3 dpa. (D) qPCR analyses of population specific markers within reporter(+) and reporter(−) cells validate the purity of FACS isolated cells. (mean ± s.e.m. n = 3 biological replicate for each cell type. Student’s t-test *P < 0.05) (E) qPCR studies in 3 dpa FACS sorted cells showed cox2a expression is significantly higher in tcf21(+) cells, relative to all other cell types examined. (F) qPCR of FACS sorted cells showed that at 3 dpa, cox2b expression was significantly higher in fli1a(+) cells relative to all other cell types examined. (G) There was no significant difference in cox1 expression among the resident cardiac cells assayed. cox1 expression in mpeg1(+) cells was significantly lower than that observed in fli1a(+) and tcf21(+) cells. Gene expression was calculated relative to cmlc2(+) cells. (mean = ±s.e.m. n = 2–5 biological replicates; 12–45 pooled ventricles per replicate. One-way ANOVA followed by Tukey’s multiple comparisons test. *P < 0.05, **P < 0.01, ***P < 0.001).
|
