|
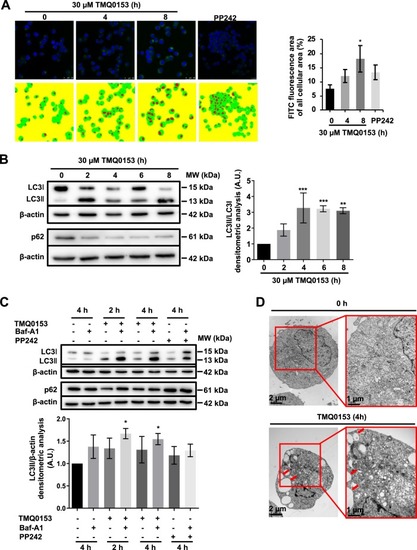
TMQ0153 stimulated autophagy prior to necroptosis.a Confocal UV microscopy analysis after staining with Cyto-ID (left panel). Representative images of FITC stained images in the 4 groups accompanied by the corresponding pseudocolor masks (red: FITC signal, green: cell area) used for calculation and the corresponding quantification of fluorescence intensity (right panel). Statistical results were compared by Kruskal–Wallis test followed by Conover post-test further adjusted by the Benjamini-Hochberg FDR method. 0 h vs. 4 h and vs 8 h (p < 0.0004 and p < 0.00006, respectively), 4 h vs.8 h (p < 0.002). b Western blot detection of LC3 and p62 protein levels (left panel) and the corresponding densitometric analysis (right panel). c Similar analysis in cells pretreated with 40 nM bafilomycin A1 (baf-A1) for 1 h (upper panel) and the corresponding densitometric analysis (lower panel). 10 µM PP242 for 4 h was used as a positive control for autophagy induction. d Transmission electron microscopy at ×12.000 and ×25.000 magnification: arrows indicate autophagolysosomes. Statistical significance was assessed as *p < 0.05, **p < 0.01, ***p < 0.001 compared to untreated cells unless otherwise specified. One-way ANOVA (western blot quantification); post hoc; Tukey’s test. Two-way ANOVA (mito stress test); post hoc; Sidak’s test.
|