|
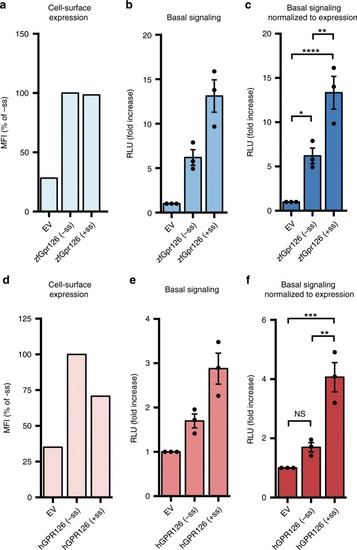
Alternative splice isoforms of Gpr126 modulate receptor signaling.a Cell-surface expression levels for empty vector (EV), zebrafish Gpr126 splice isoforms, measured using flow cytometry to detect binding of anti-FLAG antibody to cells expressing FLAG-tagged Gpr126. The Gpr126 cell-surface expression levels are normalized to the control EV signal. Data are shown as MFI (mean fluorescence intensity). Error bars are not shown because expression levels are presented as median fluorescence intensities of 10,000 cells for each population of transfected cells, for a single flow cytometry experiment representative of at least three independent experiments. b Basal signaling measured by the cAMP signaling assay. Data are shown as fold increase over EV of RLU (relative luminescence units). c Basal cAMP signaling normalized to cell-surface expression. ns, P > 0.05; *P ≤ 0.05; **P ≤ 0.01; ***P ≤ 0.001; ****P ≤ 0.0001; by one-way ANOVA and Tukey’s multiple comparisons test. Data in b and c are presented as mean ± SEM, n = 3, and are representative of at least three independent experiments. d–f Same as a–c but for human GPR126 splice isoforms. Source data are provided as a Source Data file.
|