
Fig. 1
- ID
- ZDB-FIG-200107-4
- Publication
- Osmani et al., 2019 - Metastatic Tumor Cells Exploit Their Adhesion Repertoire to Counteract Shear Forces during Intravascular Arrest
- Other Figures
- All Figure Page
- Back to All Figure Page
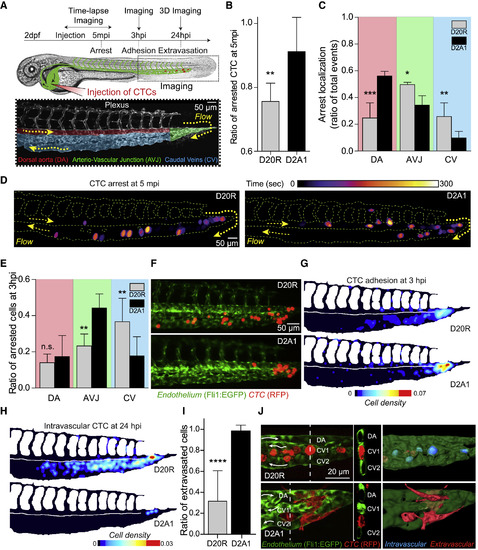
Highly Metastatic D2A1 Cells Are More Prone to Stable Arrest in Larger Vessels Than D20R Cells In Vivo (A) Scheme of the experimental approach using 2 dpf Tg(Fli1:EGFP) zebrafish embryos as a metastatic cascade model. Bottom panel: blood flow in the plexus regions: dorsal aorta (DA), arterio-venous junction (AVJ), and caudal veins (CVs). (B–D) The arrest of D20R or D2A1 cells was live-imaged for 5 min immediately after injection. (B) The ratio of cells stably arrested after 5 min over the total number of cells was measured. (C) The number and localization (see A) of cell arrests over the total number of arrests in the plexus were measured. The graphs show the mean ± SD of 3 independent experiments. (D) Representative time projection images from zebrafish embryo injection videos with indicated siRNA transfected cells. The color code shows the arrest time of CTCs. (E–G) The adhesion pattern of D20R or D2A1 cells was imaged 3 h after injection. (E) The number and localization (see A) of cells stably adhered at 3 hpi were measured. The graph shows the mean ± SD of 3 independent experiments. (F) Representative images of cells arrested at 3 hpi. (G) The heatmaps show quantification of the number and location of stably arrested CTCs at 3 hpi in the caudal plexus. (H and I) The D20R or D2A1 cell localization pattern was imaged 24 h after injection with 3D confocal imaging. (H) The heatmaps show quantification and location of intravascular CTCs at 24 hpi in the caudal plexus. (I) The ratio of cells extravasated (extravascular) over the total number of cells was measured. The graph shows the mean ± SD of 3 independent experiments. (J) Representative images and orthoslice of cells at 24 hpi. The 3D rendering shows intravascular (blue) and extravascular (red) cells at 24 hpi. |