FIGURE

Figure 4

ID
ZDB-FIG-200104-25
Publication
Morbiato et al., 2019 - Feeding Entrainment of the Zebrafish Circadian Clock Is Regulated by the Glucocorticoid Receptor
Other Figures
All Figure Page
Back to All Figure Page
Figure 4

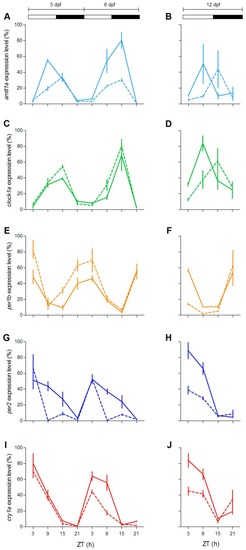
Daily expression levels of clock genes in zebrafish larvae. Quantitative polymerase chain reaction (qPCR) analysis of clock and light-regulated clock gene expression at 5–6 dpf (A,C,E,G,I) and 12 dpf (B,D,F,H,J) in zebrafish larvae exposed to LD cycles. For all panels, each point represents the mean ± SEM (n = 4). On the y-axes are plotted relative expression levels (100% is the maximum level detected for each gene in all dpf), while on the x-axes time is expressed as zeitgeber time (ZT, where ZT0 represents lights on). White and black bars represent light and dark periods, respectively. gr+/+ = solid line; gr−/− = dotted line.

Expression Data

Expression Detail
Antibody Labeling
Phenotype Data

Phenotype Detail
Acknowledgments
This image is the copyrighted work of the attributed author or publisher, and ZFIN has permission only to display this image to its users. Additional permissions should be obtained from the applicable author or publisher of the image. Full text @ Cells