
FIGURE
Figure 6
- ID
- ZDB-FIG-200101-32
- Publication
- Murat El Houdigui et al., 2019 - A systems biology approach reveals neuronal and muscle developmental defects after chronic exposure to ionising radiation in zebrafish
- Other Figures
- All Figure Page
- Back to All Figure Page
Figure 6
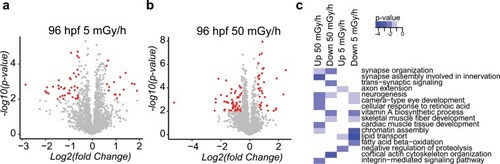
Volcano plots of deregulated proteins in 96 hpf larvae exposed ( |
Expression Data
Expression Detail
Antibody Labeling
Phenotype Data
Phenotype Detail
Acknowledgments
This image is the copyrighted work of the attributed author or publisher, and
ZFIN has permission only to display this image to its users.
Additional permissions should be obtained from the applicable author or publisher of the image.
Full text @ Sci. Rep.