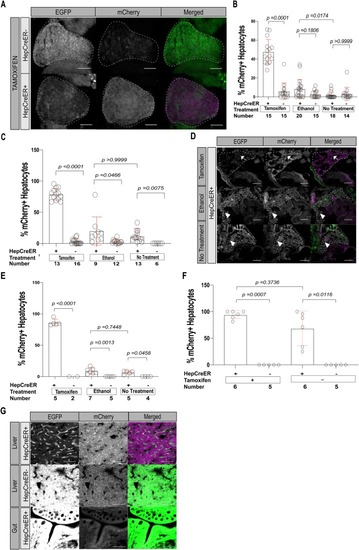
Analysis of Tg(ubi:switch) larvae shows fabp10a:CreERT2 leads to significant switching by 10 dpf even in the absence of tamoxifen treatment. (A,B) Switching in Tg(ubi:switch) zebrafish without (HepCreER−) and with (HepCreER+) the fabp10a:CreERT2 transgene, incubated with 4-hydroxytamoxifen (tamoxifen), ethanol, or egg water alone (no treatment) from 3 to 6 dpf and imaged at 6 dpf for EGFP and mCherry expression. Successful switching is indicated by loss of EGFP and gain of mCherry expression. (A) Representative images. Scale bars: 50 µm. Livers are outlined. (B) Scatter plot with bar graph quantifying switching in terms of ratio of hepatocytes that switched (mCherry+) relative to the total number of hepatocytes, ±s.d. P-values derived using Kruskal–Wallis non-parametric ANOVA followed by Dunn's multiple comparisons test. Graph shows combined data from two experiments. (C,D) Quantification of switching at 10 dpf in Tg(fabp10a:CreERT2);Tg(ubi:switch) (HepCreER+) and Tg(ubi:switch) (HepCreER−) larvae, incubated with tamoxifen, ethanol, or no treatment from 3 to 6 dpf. (C) Scatter plot with bar graph showing percentage of hepatocytes that switched (mCherry+) relative to the total number of hepatocytes, ±s.d. P-values obtained using Kruskal–Wallis non-parametric ANOVA followed by Dunn's multiple comparisons test. Graph represents combined data values from three experiments. (D) Representative images of HepCreER+ larvae. In TAM-treated zebrafish (top panels), most hepatocytes show switching (loss of EGFP and gain of mCherry expression); arrows indicate hepatocytes without switching. HepCreER+ zebrafish not treated with TAM (middle and bottom panels) show occasional cells with switching (arrowheads). Livers are outlined. Scale bars: 50 µm. (E) Quantification of switching at 20 dpf in HepCreER+ and HepCreER− larvae, incubated with tamoxifen, ethanol, or no treatment from 3 to 6 dpf. Scatter plot with bar graph shows percentage of hepatocytes that switched (mCherry+) relative to the total number of hepatocytes, ±s.d. P-values obtained using Sidak's multiple comparisons test following ordinary one-way ANOVA. This experiment was performed once. (F,G) Quantification of switching in adult (3 mpf) HepCreER+ and HepCreER− zebrafish, incubated with tamoxifen, ethanol, or no treatment from 3 to 6 dpf. (F) Scatter plot with bar graph shows the percentage of hepatocytes that switched (mCherry+) relative to the total number of hepatocytes, ±s.d. Graph represents combined data values from two experiments. P-values obtained using non-parametric Kruskal–Wallis test followed by Dunn's multiple comparisons test. (G) Representative images of liver (top and middle panels) or gut (bottom panel) cryosections showing complete switching (top panel) or no switching (middle and bottom panels). Scale bars: 40 µm.
|
