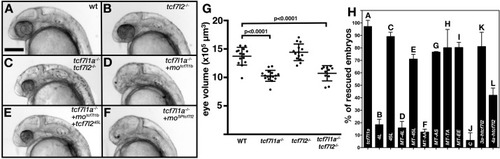
(A–F) Lateral views (anterior to left, dorsal up) of 28hpf live wildtype (A), tcf7l2 zf55/ zf55 (B), double tcf7l1a-/-/tcf7l2 zf55/ zf55 (C) and tcf7l1a-/- (D–F) zebrafish embryos with injected reagents indicated top right showing representative phenotypes. (D) 0.12 pmol motcf7l1b (E), 0.12 pmol motcf7l1b and 20 pg of 45L-tcf72 splice variant mRNA, (F) 1.25 pmol moSPtcf7l2. Scale bar in (A) is 200 µm. (G) Plot showing the volume of eyes (µm3) of 30hpf fixed embryos coming from a double heterozygous tcf7l1a/tcf7l2 mutant incross. Error bars are mean ± SD, only P values greater than 0.1 from unpaired t test with Welch's correction are indicated. Data in Supplementary file 1C. (H) Bars represent the percentage of tcf7l1a-/- embryos that develop eyes (with distinguishable lens and pigmented retina) coming from multiple tcf7l1a+/- female to tcf7l1a-/- males crosses, injected with 0.12 pmol of motcf7l1b (all bars) and co-injected with constructs stated on X axis: 10 pg of tcf7l1a mRNA (A) 20 pg of tcf7l2 mRNA splice variants 4L-tcf7l2 (B) 45L-tcf7l2, (C) MT-4L-tcf7l2 (D) MT-45L-tcf7l2 (E) MT-tcf7l2-AA (F) MT-tcf7l2-AS (G) MT-tcf7l2-TA (H) MT-tcf7l2-AA (I) htcf7l2-C (J) htcf7l2-3a (K) and htcf7l2-4a (L). Data for all these plots are included in Supplementary file 1E. Error bars are mean ± SD
|
