
Fig 3
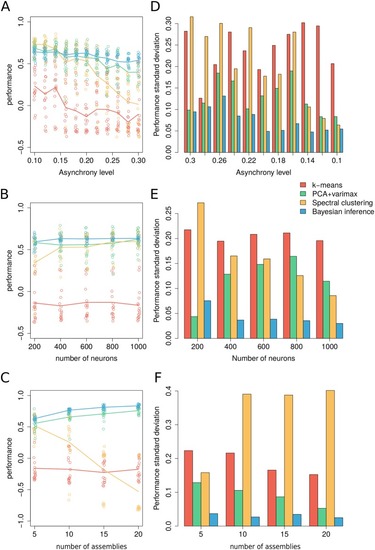
(A) Performance comparison across levels of asynchrony. Dots correspond to independently generated data sets while solid lines show the average performance for each method over all simulated data. (B) Comparison across number of neurons. (C) Comparison across number of assemblies. (D-F) Standard deviation of the performance across simulated data per parametric condition. Unless specified otherwise, surrogate datasets were generated using 400 neurons and 1000 time frames distributed over 5 assemblies with assembly activity of 5%, synchrony 50% and asynchrony 10%. For |