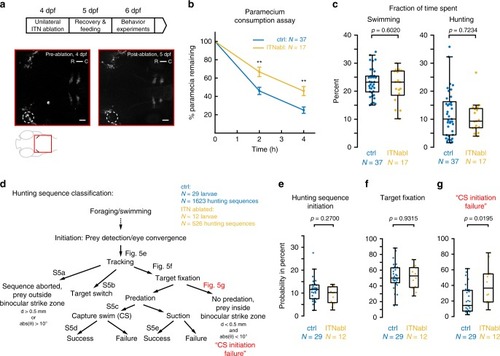
ITNs are required for the initiation of capture swims when prey is positioned in the binocular strike zone. a Experimental design for ablations and subsequent behavioral tracking. 12–26 ITNs were unilaterally laser-ablated in 4 dpf ITNGal4, UAS:GCaMP3 larvae, left to recover and fed with paramecia on 5 dpf. Behavior experiments were performed at 6 dpf. ITN-ablated ITNGal4, UAS:GCaMP3 larvae were imaged at 4 dpf (lower panels, pre-ablation) and again at 5 dpf (post-ablation). Dotted ellipse indicates ablated cells. Scale bars = 25 μm. b Paramecium consumption for control (n = 34 non-ablated larvae and n = 3 sham-ablated larvae) and ITN-ablated larvae (n = 17 larvae, 12–26 ITNs ablated). ITN-ablated larvae consume paramecia at a reduced rate compared with control larvae (percentage of remaining paramecia relative to the number of paramecia at t = 0 h, whiskers denote 95% confidence intervals, Mann–Whitney U-test, t = 2 h: p = 0.0036, t = 4 h: p = 0.0013). c Fraction of time spent swimming and time spent hunting for control (n = 37) and ITN-ablated (n = 17) larvae (Mann–Whitney U-test, swimming: median (ctrl) = 23.2%, median (ITNabl) = 23.2%, p = 0.6020//hunting: median (ctrl) = 10%, median (ITNabl) = 9.3%, p = 0.7234). d Schematic illustrating classification of individual hunting sequences. Figure references refer to the respective panels in Fig. 5 and Supplementary Fig. 5. In total, 1623 hunting sequences from 29 control larvae and 526 hunting sequences from 12 ITN-ablated larvae were analyzed. e ITN-ablated larvae initiate hunting with comparable probability to control larvae (control: median hunting sequence initiation probability = 11.6 %, ITN-ablated: median hunting sequence initiation probability = 10.2%, Mann–Whitney U-test, p = 0.2700). f ITN-ablated larvae fixate targets with a comparable probability to control larvae (control: median target fixation probability = 50.0%, ITN-ablated: median target fixation probability = 52.7%, Mann–Whitney U-test, p = 0.9315). g ITN-ablated larvae initiate capture swims at lower probability when prey is positioned in the binocular strike zone (prey at <0.5 mm distance, ±10° azimuth) compared with controls (Mann–Whitney U-test, p = 0.0195, control: median failure rate = 14.3 %, ITN-ablated: median failure rate = 36.5 %). Central marks of boxplots indicate the respective median. Bottom and top edges correspond to 25th and 75th percentiles. Source data for Fig. 5b–g are provided as Source Data File.
|
