|
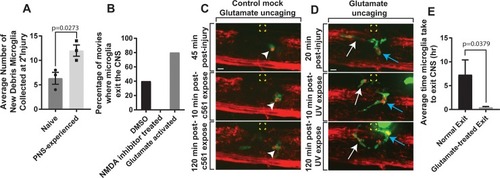
Glutamate-NMDA induces migration of microglia to the PNS.(A) Quantification of the average number of new debris from PNS-primed microglia collected at the secondary injury site compared to naïve CNS microglia (p = 0.0273). (B) Quantification of the percentage of movies in which microglia exit the CNS in DMSO, NMDA inhibitor treated, and glutamate uncaged in PNS cases. (C) Images from 24-hour time-lapse movies starting at 4 dpf in Tg(pu1:gfp);Tg(sox10:mrfp) MNI-L-glutamate treated zebrafish showing the response of microglia pre- and post-mock glutamate uncaging. Arrowheads denote microglia. Yellow box indicates uncaging site. (D) Images from 24-hour time-lapse movies starting at 4 dpf in Tg(pu1:gfp);Tg(sox10:mrfp) MNI-L-glutamate treated zebrafish showing the response and ectopic migration of microglia pre- and post-glutamate uncaging. White arrow denotes first microglia; blue arrow indicates a second microglia. Yellow box indicates uncaging site. (E) Quantification of the average time microglia took to exit the CNS post-glutamate uncaging (p = 0.0379). Scale bar equals 10 μm (C, D). Statistics summarized in S1 Table. See S3 Data for raw data. CNS, central nervous system; dpf, days post fertilization; MNI-L, 4-Methoxy-7-nitroindolinyl-caged-L-glutamate; NMDA, N-methyl-D-aspartate receptor; PNS, peripheral nervous system.
|