FIGURE

Figure 7

ID
ZDB-FIG-191220-53
Publication
Malhotra et al., 2019 - Ecotoxicity Assessment of Fe3O4 Magnetic Nanoparticle Exposure in Adult Zebrafish at an Environmental Pertinent Concentration by Behavioral and Biochemical Testing
Other Figures
All Figure Page
Back to All Figure Page
Figure 7

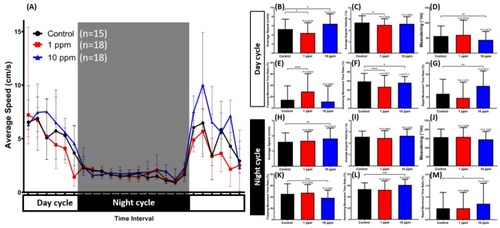
The circadian rhythm assay for Fe3O4 MNPs-exposed zebrafish after 14-day exposure. (A) Comparison of chronological changes of the average speed in light and dark cycles. The grey area shows the dark period while the white area shows the light period. Comparison of the (B) average speed, (C) average angular velocity, (D) meandering, (E) freezing movement time ratio, (F) swimming movement time ratio, and (G) rapid movement time ratio at the light cycle. Comparison of the (H) average speed, (I) average angular velocity, (J) meandering, (K) freezing movement time ratio, (L) swimming movement time ratio, and (M) rapid movement time ratio during the dark cycle. The data are expressed as the median with an interquartile range and were analyzed by a Kruskal-Wallis test, which continued with Dunn’s multiple comparisons test as a follow-up test (n = 15 for control, n = 18 for 1 and 10 ppm MNPs-exposed group, * p < 0.05, ** p < 0.01, *** p < 0.001, **** p < 0.0001).

Expression Data

Expression Detail
Antibody Labeling
Phenotype Data

Phenotype Detail
Acknowledgments
This image is the copyrighted work of the attributed author or publisher, and ZFIN has permission only to display this image to its users. Additional permissions should be obtained from the applicable author or publisher of the image. Full text @ Nanomaterials (Basel)