
Fig. 5
- ID
- ZDB-FIG-191118-5
- Publication
- Ando et al., 2019 - Peri-arterial specification of vascular mural cells from naïve mesenchyme requires Notch signaling
- Other Figures
- All Figure Page
- Back to All Figure Page
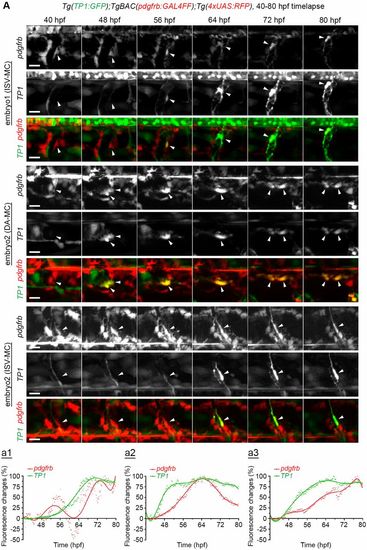
Time-lapse imaging of TP1 reporter expression in MCs. (A) Time-lapse imaging of the trunk region (ISV or DA) of Tg(TP1:GFP);TgBAC(pdgfrb:GAL4FF);Tg(4xUAS:RFP) every 12 min (see also Movie 1). Increase of RFP signal was observed in the cells positive for GFP expression (Notch activation) (arrows). Representative images at indicated time points and fluorescence changes (a1-a3) showing % of the peak value of pdgfrb or TP1 reporter fluorescence intensity after the subtraction of each fluorescent intensity of the first flame. Quantifications a1 (dorsal side) and a2 (ventral side) correspond to one of the ISV-MCs in embryo 1 (see Movie 1), and a3 corresponds to an ISV-MC in embryo 3 (images not shown). Red dots, pdgfrb reporter; green dots, TP1 reporter. Polynomial fitting curves for the pdgfrb (red line) and TP1 (green line) were assigned using the polyfit function in MATLAB with the degree of 7. Scale bars: 15 μm. |
| Gene: | |
|---|---|
| Fish: | |
| Anatomical Terms: | |
| Stage Range: | Prim-25 to Protruding-mouth |