
Fig. 3
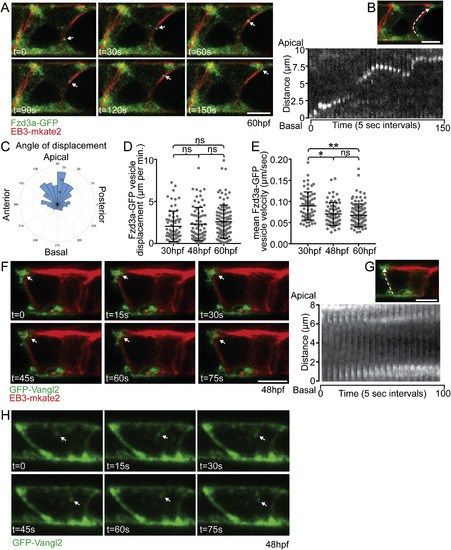
Fzd3a and Vangl2 trafficking in the floorplate. (A) Single timepoints from a time lapse movie of a 60hpf Tg(shh:gal4); Tg(uas:Fzd3a-GFP); Tg(uas:EB3-mkate2) dual transgene expressing floorplate cell in lateral view showing EB3-mKate2-labeled MTs (red) and Fzd3a-GFP vesicles (green). Arrows track an individual Fzd3a-GFP vesicle as it moves in the apical and posterior direction along a MT. (B) inset image: overlay shows measurement path used to generate kymograph. Kymograph: plot showing the apically directed movement of a single Fzd3a-GFP vesicle along a MT polymer. (C–E) Fzd3a-GFP vesicular movements were tracked during 5-s interval time lapse movies of laterally-viewed floorplate cells in Tg(shh:gal4); Tg(uas:Fzd3a-GFP); Tg(uas:EB3-mkate2) embryos at 30, 48, and 60hpf. N = 240 vesicles, 89 cells, 9 embryos. (C) Rose plot of final relative displacement angles of individual Fzd3a-GFP containing vesicles between first and last measured positions. (D) Quantitation of individual Fzd3a-GFP vesicle displacement distances between first and last timepoint measured, divided by total tracking time. Significance was determined with a Kruskal-Wallis test with Dunn's multiple comparison. (E) Quantitation of average velocities of individual Fzd3a-GFP vesicles. **p < 0.0001; *p = 0.0023; significance was determined with a Kruskal-Wallis test with Dunn's multiple comparison. (F) Single timepoints from a time lapse movie of a 48hpf Tg(shh:gal4); Tg(uas:GFP-Vangl2); Tg(uas:EB3-mkate2)dual transgene expressing floorplate cell in lateral view. MTs are labeled by EB3-mkate2 (red) and GFP-Vangl2 is shown in green. Arrows indicate GFP-Vangl2 anterior apical localization, which does not change over time. (G) inset image: overlay showing measurement path used to generate kymograph. Kymograph showing the absence of GFP-Vangl2 trafficking along the MT polymer. (H) Single timepoints of a Tg(shh:gal4); Tg(uas:GFP-Vangl2) floorplate cell demonstrating a rare example of detectable GFP-Vangl2 cytosolic puncta. Anterior to left in all images. Approximate cell boundaries indicated by white dotted lines. Scale bars: 5 μm. |
| Genes: | |
|---|---|
| Fish: | |
| Anatomical Terms: | |
| Stage Range: | Long-pec to Pec-fin |
Reprinted from Developmental Biology, 452(1), Mathewson, A.W., Berman, D., Moens, C.B., Microtubules are required for the maintenance of planar cell polarity in monociliated floorplate cells, 21-33, Copyright (2019) with permission from Elsevier. Full text @ Dev. Biol.