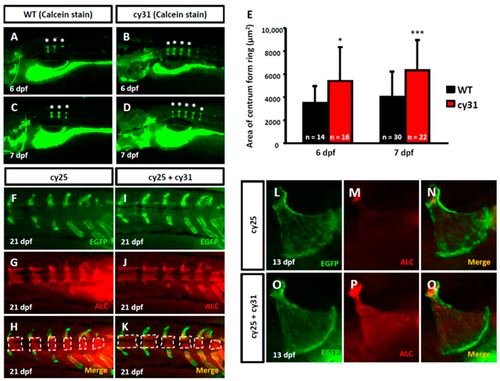
Evaluation of calcification in N1aICD-expressed transgenic zebrafish. (A–D) Calcein staining on wild type and Tg(Ola.Sp7:N1aICD)cy31 embryos at 7 days post-fertilization (dpf). The * indicates the formed column. (E) Quantification of calcification degree by calculating the area of ring centrum formation in the notochord. N represents the fish number used for analysis. (F,G,H) EGFP-expressed osteoblasts in green fluorescence, alizarin complexone (ALC) staining region and merged image in notochord of Tg(Ola.Sp7:EGFP)cy25 transgenic fish aged at 21 dpf. (I,J,K) N1aICD-expressed osteoblasts in green fluorescence, ALC staining region and merged image in notochord of double transgenic fish of Tg(Ola.Sp7:EGFP)cy25 and Tg(Ola.Sp7:N1aICD)cy31 at 21 dpf. The dashed line surrounded areas were measured using image quantitation and summed up for comparison. (L,M,N) EGFP-expressed osteoblasts in green fluorescence, ALC staining region and merged image in opercula of Tg(Ola.Sp7:EGFP)cy25 at 13 dpf. (O,P,Q) N1aICD-expressed osteoblasts in green fluorescence, ALC staining region and merged image in opercula of Tg(Ola.Sp7:EGFP)cy25 and Tg(Ola.Sp7:N1aICD)cy31 double transgenic fish at 13 dpf (averages ± SD; * p < 0.05; *** p < 0.005; n = fish number).
|
