Fig. 2
- ID
- ZDB-FIG-190821-14
- Publication
- D'Agati et al., 2019 - Active receptor tyrosine kinases, but not Brachyury, are sufficient to trigger chordoma in zebrafish
- Other Figures
- All Figure Page
- Back to All Figure Page
|
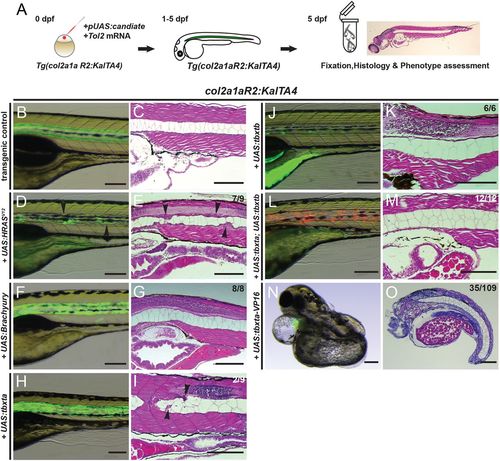
Overexpression of brachyury genes in the zebrafish notochord is insufficient to initiate chordoma. (A) Workflow of injection-based notochord hyperplasia assessment: at the one-cell stage, Tg(col2a1aR2:KalTA4) embryos are injected with Tol2 transposase mRNA and a plasmid containing a fluorescently labeled candidate gene under UAS control; injected embryos are raised up to 5 dpf and candidate gene expression is monitored through notochord fluorescence. Embryos with consistent reporter expression are fixed, sectioned and stained with H&E to assess the notochord phenotype using light microscopy. (B-O) Close-up lateral view of embryo notochords at 5 dpf, for brightfield and fluorescence (left column) and H&E histology (right column; different embryos per condition); numbers indicate observed versus total from an individual representative experiment. (B,C) The col2a1aR2:KalTA4 control reference at 5 dpf, expressing UAS:Kaede to fluorescently label the notochord. (D,E) Transient injection of UAS:EGFP-HRASV12 causes localized notochord hyperplasia (arrowheads). (F-I) Forced expression of human TBXT (brachyury) (F,G) or of the zebrafish gene tbxta (H,I) does not affect notochord development or cell proliferation. Minor lesions caused by collapsed vacuolated cells developed in a few UAS:tbxta-expressing notochords (arrowheads, I). (J,K) Overexpression of the second zebrafish brachyury gene tbxtb does not affect notochord development or proliferation. (L,M) Combined overexpression of both zebrafish brachyury genes tbxta and tbxtb has no effect on proliferation and the notochord develops normally. (N,O) Notochord-driven expression of tbxta-VP16, encoding a dominant-active transcriptional activator, leads to non-autonomous defects in the trunk with a shortened and/or severely curled trunk (32% of analyzed embryos), whereas the notochord forms normally. Scale bars: 200 μm. |

