
Fig. 2
- ID
- ZDB-FIG-190814-32
- Publication
- McConnell et al., 2018 - Neural crest state activation in NRAS driven melanoma, but not in NRAS-driven melanocyte expansion
- Other Figures
- All Figure Page
- Back to All Figure Page
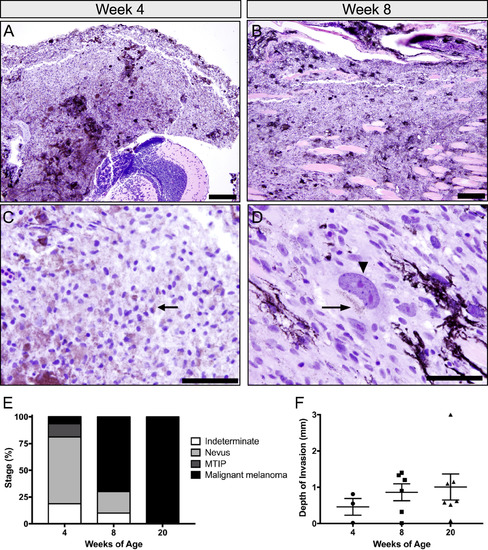
Histologic analysis of casper;mcr:NRAS zebrafish. (A-D) H&E of casper;mcr:NRAS fish. (A and C) Melanocytic tumor of indeterminate potential (MTIP) at 4 weeks of age (original magnification 200 ×). High magnification image in C shows an epithelioid morphology with minimal cytologic atypia (original magnification 1000 ×). (B and D) Malignant melanoma collected at 8 weeks of age, showing infiltrative growth through underlying skeletal muscle (original magnification 200 ×). A high magnification image shows cytologically malignant cells with significant anisonucleosis and prominent nucleoli (original magnification 1000 ×). Arrowhead shows enlarged nuclei with prominent nucleoli and arrows show melanin pigment. Scale bars represent 50 µm for (A) and (B) and 20 µm for (C) and (D). (E) Tumors collected at 4, 8, and 20 weeks were scored as either indeterminate, nevus (F-nevi), MTIP, or malignant melanoma based on histological assessment. n = 9–16 (F) No significant difference in the depth of invasion from the basement membranebetween 4, 8, and 20 week MTIP and melanomas (one-way ANOVA). n = 3–7. |
Reprinted from Developmental Biology, 449(2), McConnell, A.M., Mito, J.K., Ablain, J., Dang, M., Formichella, L., Fisher, D.E., Zon, L.I., Neural crest state activation in NRAS driven melanoma, but not in NRAS-driven melanocyte expansion, 107-114, Copyright (2018) with permission from Elsevier. Full text @ Dev. Biol.