
Fig. 3
- ID
- ZDB-FIG-190814-15
- Publication
- Amini et al., 2019 - Stochastic single cell migration leads to robust horizontal cell layer formation in the vertebrate retina
- Other Figures
- All Figure Page
- Back to All Figure Page
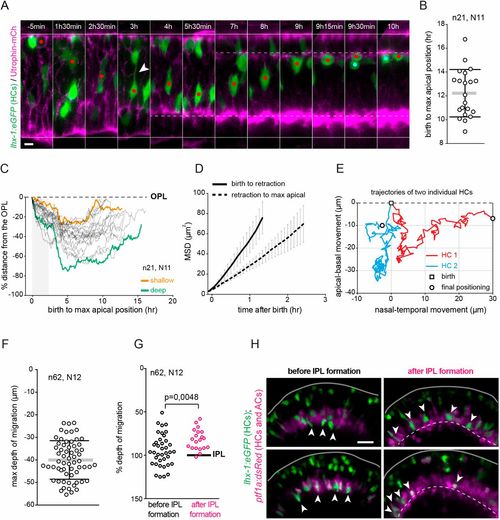
Bi-directional HC migration is heterogenous but HCprs always stopover within the amacrine cell layer and heterogeneity in HC depth depends on IPL formation. (A) Montage of HC migration from HCpr birth to final positioning. lhx-1:eGFP (HC and PR, green) and Utrophin-mCherry (cell outline, magenta). Red dot indicates tracked cell; white arrowhead indicates apical process before detachment; red and cyan dots indicate sister HCs after terminal division. Time is relative to HC birth. White lines indicate apical surface (top) and basal membrane (bottom). White dotted lines indicate OPL (top) and IPL (bottom). Scale bar: 5 µm. (B) Scatter plot of HC birth to max apical position. Data are mean±s.d. (C) Single cell trajectories of HC bidirectional migration from birth to final positioning as a percentage of the total thickness of the retina. The orange and green lines provide examples of a shallow and a deep track, respectively. The shadow indicates the initial stage of migration. (D) Mean square displacements±s.d. of HC for different phases; from birth to apical process retraction (solid line) from retraction to final positioning (dashed line). (E) Representative examples of HC migration along the apical-basal and nasal-temporal retinal axis. (F) Distribution of HC maximum migration depth. Data are mean±s.d. with individual data points indicated. (G) Percentage of HC maximum migration depth relative to the retinal thickness, before (black circles) and after (magenta circles) IPL (black line) formation. (H) Examples of HC migration before and after IPL formation. lhx-1:eGFP (HC and PRs, green) and ptf1a:dsRed (ACs and HCs, magenta). Solid and dashed white lines indicate apical surface and IPL, respectively. White arrowheads indicate HC position. Scale bar: 10 µm. |