
FIGURE
Fig. 1
- ID
- ZDB-FIG-190801-46
- Publication
- Neukum et al., 2019 - Automated Classification of Fertilized Zebrafish Embryos
- Other Figures
- All Figure Page
- Back to All Figure Page
Fig. 1
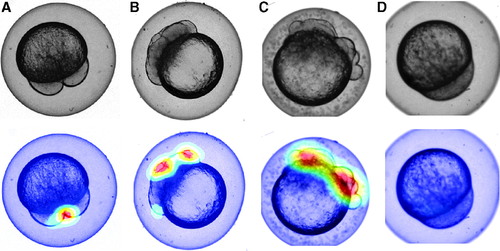
(A–C) Cropped images of embryos in the 2- to 16-cell stage, (D) embryo that is not in the 2- to 16-cell stage. Top row: cropped original images. Bottom row: images superimposed with a heat map that visualizes the areas of the image that strongly influence the result of the classification algorithm (red areas have the highest impact). |
Expression Data
Expression Detail
Antibody Labeling
Phenotype Data
Phenotype Detail
Acknowledgments
This image is the copyrighted work of the attributed author or publisher, and
ZFIN has permission only to display this image to its users.
Additional permissions should be obtained from the applicable author or publisher of the image.
Full text @ Zebrafish