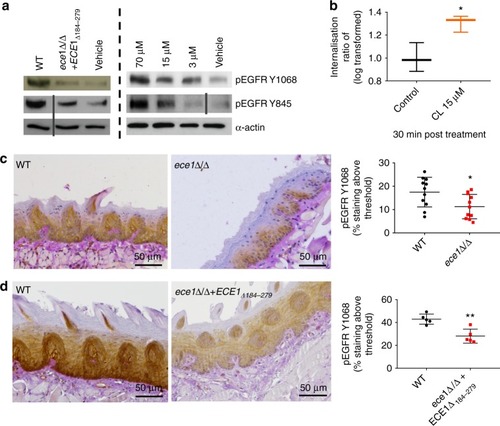
Candidalysin (CL) activates EGFR. a Phosphorylation: Infection of TR146 cells with WT C. albicans induces EGFR phosphorylation at two distinct tyrosine sites, Y1068 and Y845, while a strain lacking the candidalysin-encoding region (ece1Δ/Δ+ECE1Δ184–279) does not (left panel). Phosphorylation of EGFR at both sites was also induced following direct candidalysin treatment in a dose-dependent manner (right panel). Data are representative of three biological repeats. Protein lysates were taken at 2 h p.i. for western blot analysis. Solid vertical lines indicate omitted, extraneous portions of blot images. b Internalisation: At 30 min post CL treatment, EGFR is significantly internalised. Data collected from a total of 120,000 cells per group over three independent experiments. Median value indicated, error bars represent min-max data points. Values are shown as a Log transformed ratio of EGFR staining intensity inside the cell to the total cell intensity of EGFR staining. c Murine pEGFR staining: Immune compromised mice were infected with a C. albicans ece1Δ/Δ mutant (lacking ECE1 which encodes the parent protein from which candidalysin is derived) and tongues were harvested at day 1 p.i. Paraffin-embedded, 3 mm tissue sections were prepared and stained for pEGFR (Y1068). The ece1Δ/Δ mutant exhibits reduced capacity to phosphorylate EGFR above a given threshold (threshold set using Image J software), when compared to WT C. albicans infections. Data from 9 (WT) and 11 (ece1Δ/Δ) individual mice obtained over two independent experiments. d Murine pEGFR staining: Immune competent mice were infected with the candidalysin-deficient ece1Δ/Δ+ECE1Δ184–279 mutant which also exhibited a reduced ability to phosphorylate EGFR at Y1068, when compared to WT infection. Data obtained from one experiment, 5 mice per group. Unpaired T-tests were used to determine statistical significance in (b, c, d). Error bars from (c, d) represent Standard deviation (SD). *p < 0.05, **p < 0.01
|
