FIGURE

Fig 2

ID
ZDB-FIG-190723-271
Publication
Blümel et al., 2019 - On the traces of tcf12: Investigation of the gene expression pattern during development and cranial suture patterning in zebrafish (Danio rerio)
Other Figures
All Figure Page
Back to All Figure Page
Fig 2

Comparison of EGFP expression in <italic>Tg(-0</italic>.<italic>2tcf12</italic>:<italic>EGFP)</italic> and <italic>Tg(-2</italic>.<italic>1tcf12</italic>:<italic>EGFP)</italic> fish.

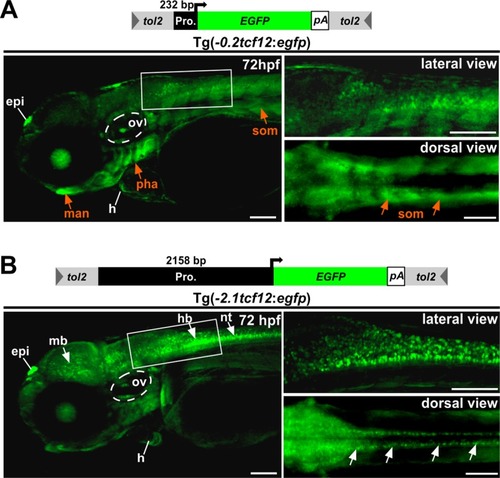
Comparison between different tcf12:EGFP transgenic lines. (A) The minimal promoter driven Tg(-0.2tcf12:EGFP) individuals show strong EGFP expressions in the gills (Pharyngeal arches), the lower jaw (mandible) and the somites (orange arrows). These expression domains are absent or rather weak in Tg(-2.1tcf12:EGFP) fish (B). Tg(-2.1tcf12:EGFP) zebrafish show a strong EGFP signal in neurons of the mid- and hindbrain and the neural tube (white arrows in B), which are lacking in the Tg(-0.2tcf12:EGFP) animals. An EGFP expression in the heart, the otic vesicle, and the epiphysis is detectable in both transgenic lines. epi, epiphysis; h, heart; hb, hindbrain; hpf, hours post fertilization; man, mandible; mb, midbrain; nt, neural tube; ov, otic vesicle; pha, pharyngeal arches; som, somites. All scale bars represent 100 μm unless otherwise stated.

Expression Data
Gene:
Fish:
Anatomical Terms:
Stage: Protruding-mouth

Expression Detail
Antibody Labeling
Phenotype Data

Phenotype Detail
Acknowledgments
This image is the copyrighted work of the attributed author or publisher, and ZFIN has permission only to display this image to its users. Additional permissions should be obtained from the applicable author or publisher of the image. Full text @ PLoS One