
FIGURE
Figure 4
- ID
- ZDB-FIG-190723-2268
- Publication
- Khandekar et al., 2012 - Zebrafish Thrombocytes: Functions and Origins
- Other Figures
- All Figure Page
- Back to All Figure Page
Figure 4
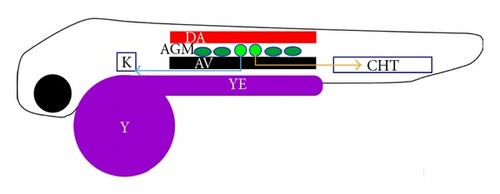
Schematic representation of thrombocyte development in zebrafish larva. DA, dorsal aorta; AV, axial vein; AGM, area corresponding to mammalian aorta- gonad- mesonephros; CHT, caudal hematopoietic tissue; K, kidney; Y, yolk; YE, yolk extension; filled small circles and ovals represent GFPLow and GFPHigh thrombocytes, respectively. The yellow and blue lines with arrows correspond to the routes of immigration of the thrombocytes. Thymus is not shown. Black circle and outline show the eye and the zebrafish body, respectively. |
Expression Data
Expression Detail
Antibody Labeling
Phenotype Data
Phenotype Detail
Acknowledgments
This image is the copyrighted work of the attributed author or publisher, and
ZFIN has permission only to display this image to its users.
Additional permissions should be obtained from the applicable author or publisher of the image.
Full text @ Adv. Hematol.