
FIGURE
Fig. 1
- ID
- ZDB-FIG-190723-2074
- Publication
- Pasquier et al., 2016 - Gene evolution and gene expression after whole genome duplication in fish: the PhyloFish database
- Other Figures
- All Figure Page
- Back to All Figure Page
Fig. 1
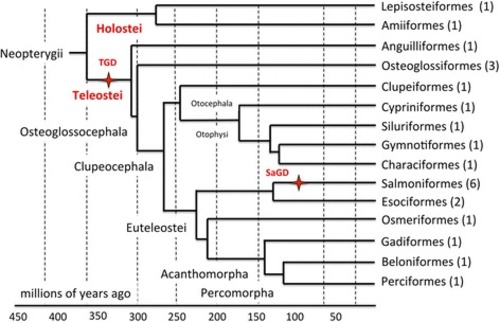
Phylogenetic tree of the PhyloFish species. Cladogram showing phylogenetic relationships among ray-finned fish analyzed in the present study. Tree topology was adapted from [ |
Expression Data
Expression Detail
Antibody Labeling
Phenotype Data
Phenotype Detail
Acknowledgments
This image is the copyrighted work of the attributed author or publisher, and
ZFIN has permission only to display this image to its users.
Additional permissions should be obtained from the applicable author or publisher of the image.
Full text @ BMC Genomics