
Figure 1
- ID
- ZDB-FIG-190723-1563
- Publication
- Perrichon et al., 2019 - MAHI-MAHI (CORYPHAENA HIPPURUS) LIFE DEVELOPMENT: MORPHOLOGICAL, PHYSIOLOGICAL, BEHAVIORAL AND MOLECULAR PHENOTYPES
- Other Figures
- All Figure Page
- Back to All Figure Page
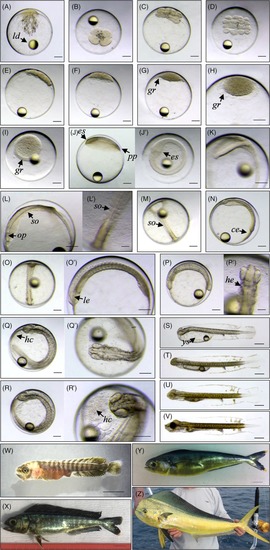
Embryo‐larval development of mahi at 26°C. A‐C, Cell cleavage. D‐I, Morula/blastula. J‐P, Gastrula/segmentation. Q–S, Pharyngula/hatching period. T–V, Post‐hatching period/yolk sac larvae. W–Y, Juvenile period. Z, Adult phase. A, Zygote stage, 1 cell (pre‐division, 0 hpf). B, 4 cells (second division, 50 mpf). C, 8 cells (third division, 70 mpf). D, 16 cells (fourth division, 80 mpf). E, 32 cells (fifth division, 120 mpf). F, 128 cells (seventh division, 3 hpf). G, 256 cells (eighth division, 4 hpf). H, 512 cells (ninth division, 5 hpf). I, Germ ring (6‐7 hpf). J, 20% epiboly (8 hpf). K, 50%‐60% epiboly (11 hpf). L, 80% epiboly, 3‐4 somites (14 hpf). M, 90% epiboly, 5‐6 somites (15 hpf). N, 100% epiboly, 8‐9 somites (16 hpf). O, 12 somites (18 hpf). P, 26+ somites (22‐23 hpf). Q, 35 hpf; R, Pre‐hatching period (38‐40 hpf). S, Hatched larvae (44 hpf). T, Yolk sac larvae (56 hpf). U, Protruding‐mouth stage (80 hpf). V, Mouth‐opening stage (104 hpf). W, Juvenile mahi (16 dph). X, 40 dph. Y, Transition to young adult phase (55 dph). Z, Adult male. ce, complete epiboly; dph, days post‐hatching; es, embryonic shield; gr, germ ring; hc, cells from hatching gland; he, heart; ld, lipid droplet; le, lens; op, optic primordium; pp, posterior pole; so, somites; ys, yolk sac. Scale bars A‐L,M‐P,Q‐R = 250 μm. Scale bars L′, P′, R′ = 100 μm. Scale bars S‐V = 500 μm. Scale bars W‐Y = 1 cm. Scale bar Z = 10 cm A–V: Photo credit: P. Perrichon; W–Z: Photo credit: J. D. Stieglitz (F) Western blot analysis of ERK activation upon NOVA2knockdown in HuLECs stimulated with VEGFC. Representative of four independent blots, lower bands non-specific in both blots. (G) Quantitative analysis of normalized pERK expression (pErk/total Erk) relative to control siRNA levels from (F) shows prolonged activation of ERK at 30 min following VEGFC treatment. (H) Summary of phosphoarray analysis from human LECs. Left: Summary of overall experimental outcome with n = 41 unchanged phospho-sites, n = 31 increased phosphorylation events and n = 13 dephosphorylationevents. Right: Representative heat map of phosphoarray outcome. Increased and decreased phosphorylation events and targets are indicated. Data generated from n = 2 independent arrays with 6 independent assays for each Ab on each array. Error bars: SD, Scale bars: 25 μm, t test (D and G) or Mann-Whitney-test (C), ∗p < 0.05, ∗∗p < 0.01, and ns, not significant. See also Figure S5. |