
Fig. 3
- ID
- ZDB-FIG-190715-3
- Publication
- Tomar et al., 2019 - Blockade of MCU-Mediated Ca2+ Uptake Perturbs Lipid Metabolism via PP4-Dependent AMPK Dephosphorylation
- Other Figures
- All Figure Page
- Back to All Figure Page
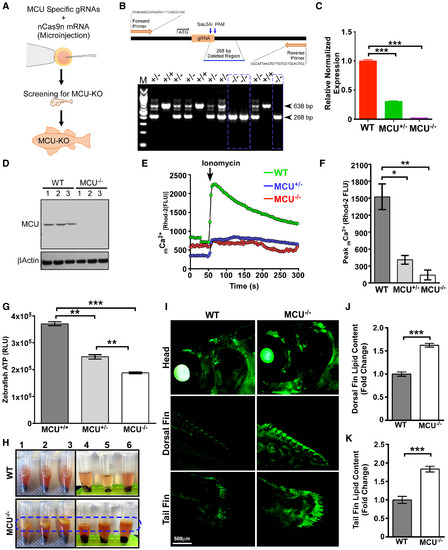
Loss of MCU Limits mCa2+ Uptake and Elevates Total Body Fat in Zebrafish (A) Schematic of the generation of global MCU KO zebrafish using CRISPR/Cas9. (B) Genotyping for MCU deletion. (C) Bar graph showing MCU mRNA abundance in WT, MCU+/−, and MCU−/− zebrafish. (D) Western blot for MCU expression. n = 3. (E) Measurement of mCa2+ uptake. n = 5–10. (F) Quantification of ionomycin-induced peak mCa2+ levels from (E). n = 5–10. (G) Bar graph representing cellular ATP levels in cells isolated from MCU+/+, MCU+/−, and MCU−/− zebrafish. n = 4. (H) Adult WT and MCU−/− zebrafish were homogenized and centrifuged. MCU−/− zebrafish samples show a clear yellow color lipid layer on top of the protein lysate. n = 6. (I) Adult WT and MCU−/− zebrafish were stained with Lipid Green to monitor the distribution of lipids in the whole body. n = 3. (J and K) Bar graphs represent the quantification of Lipid Green staining from the dorsal (J) or tail (K) fin. n = 3. Statistical analysis: mean ± SEM. ∗p < 0.05, ∗∗p < 0.01, ∗∗∗p < 0.001. |
| Fish: | |
|---|---|
| Observed In: | |
| Stage: | Adult |