
Fig. 2
- ID
- ZDB-FIG-190628-10
- Publication
- Zhao et al., 2019 - In Vivo imaging of β-cell function reveals glucose-mediated heterogeneity of β-cell functional development
- Other Figures
- All Figure Page
- Back to All Figure Page
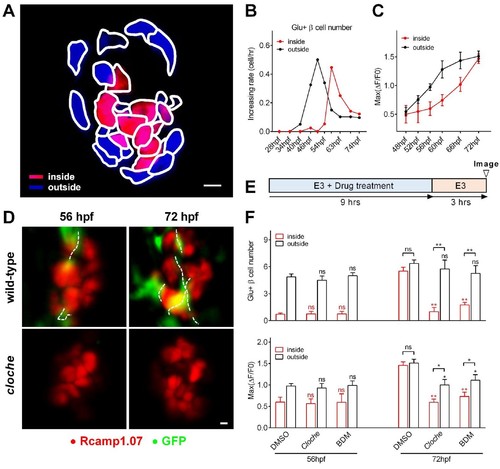
Sequential functional acquisition of β-cells from the mantle to the core of the islet was coordinated by islet microcirculation.(A) A schematic illustrating the classification of β-cells into two populations: the cells in the outside (mantle, blue) and the cells in the inside (core, red) of the islet. (B) Time-dependent increases in the number of glucose-responsive β-cells in the mantle (dark) and core (red) of the islet. n = 12–16 embryos per stage. (C) Time-dependent increases in the maximum amplitude of the glucose-triggered Ca2+ transients in β-cells from the mantle and the core of the islet. n = 12–16 embryos per stage. (D) Representative 3D-projections of the β-cells (red) and blood vessels (green) in live wild type or cloche-/- Tg (ins:Rcamp1.07);Tg (flk1:GFP) embryos. (E) The experimental design for 2,3-BDM treatment used in (F). (F) The number of glucose-responsive β-cells (top) and their maximal Ca2+ responses to glucose (bottom) in the mantle and the core of the islets in cloche-/- mutants and 2,3-BDM-treated embryos. n = 4–6 embryos per stage. *p<0.05, **p<0.01; ns, not significant. Scale bars: 10 μm; scale bars apply to (A) and (D). See also Figure 2—figure supplements 1–3 and Video 4. |