
Fig. 6
- ID
- ZDB-FIG-190626-31
- Publication
- Kota et al., 2019 - M-Ras/Shoc2 signaling modulates E-cadherin turnover and cell-cell adhesion during collective cell migration
- Other Figures
- All Figure Page
- Back to All Figure Page
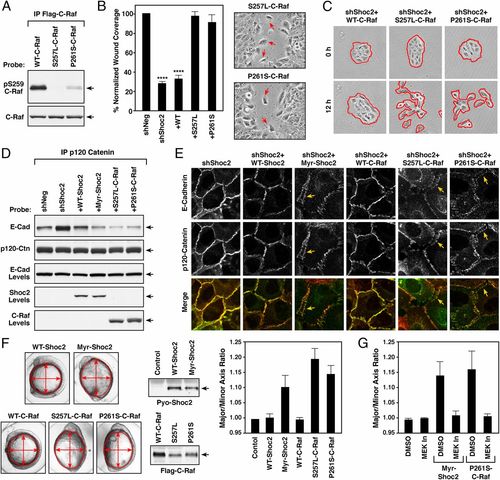
GOF activity of Noonan-associated Myr-Shoc2 and C-Raf mutants. (A) The indicated Flag-C-Raf proteins were isolated from MCF10A cells and probed for the phosphorylation state of S259 using pS259-C-Raf antibodies. (B and C) Wound-healing (B) and cell-scattering assays (C) were conducted using cells stably expressing shNeg, shShoc2, or shShoc2 and either Flag-tagged WT-, S257L- or P261S-C-Raf. Red arrows indicate cells dissociating from the leading edge of monolayers expressing S257L- and P261S-C-Raf in B. Red lines indicate free cell edges in C. (D and E) MCF10A cells stably expressing shShoc2 or shShoc2 and the indicated Shoc2 or C-Raf proteins were generated. The cell lines were then examined for binding between p120-catenin and E-cadherin in immunoprecipitation assays (D) and for E-cadherin and p120-catenin localization in live cell imaging studies (E). Arrows indicate the “stretched” appearance of the cell–cell junctions in lines expressing the Noonan-associated mutants. (F) mRNA encoding the indicated Shoc2 and C-Raf proteins were injected into one-cell stage zebrafish embryos, and the embryos were measured at 11 h postfertilization (hpf) to determine the major to minor axis ratio. Shown are representative images of the embryos, expression levels of the indicated proteins, and the average axis ratio of embryos analyzed in three independent experiments. (G) mRNA-injected embryos were treated with DMSO or 7 μM PD0325901 (MEK In) from 4.5 to 5.5 hpf, and embryos were measured at 11 hpf. The average axis ratio of embryos analyzed in three independent experiments is shown. Error bars represent mean ± SD, ****P > 0.0001. |