
Fig. S3
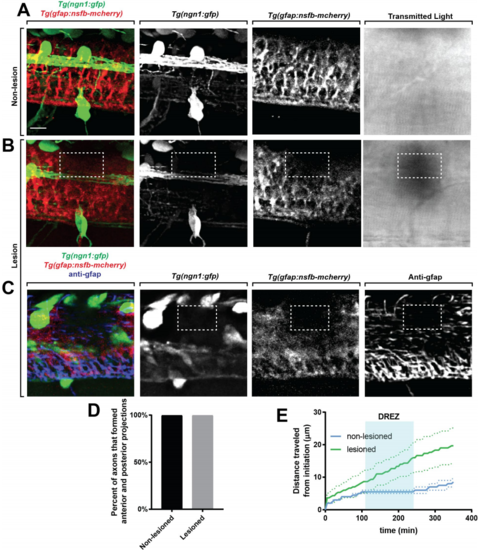
Focal lesions cause ablation of glia limitans, related to Figure 4. (A-B). Confocal images of a Tg(ngn1:gfp); Tg(gfap:nsfb-mcherry) zebrafish with (B) and without (A) a DREZ lesion. Images taken of the DREZ using transmitted light are also included. Dashed white box denotes lesion. (C). Confocal images of a Tg(ngn1:gfp); Tg(gfap:nsfb-mcherry) zebrafish with a lesioned DREZ stained for GFAP. Dashed white box denotes lesion. (D). Quantification of the percent of axons with a lesioned and nonlesioned DREZ that form anterior and posterior projections in the spinal cord. n=5 lesioned, n=5 non-lesioned. (E). Graph of distance traveled by axons with a lesioned (green) and non-lesioned (blue) DREZ. Shaded blue box denotes the area of the DREZ. Dotted lines denote SEM. Note: Lesioned axons travel further distances because of the absence of stalling at the DREZ. Scale bars denote 10 µm. |