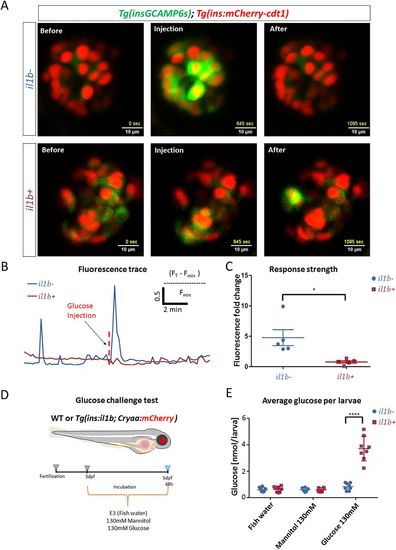
β-cell inflammation leads to reduced glucose responsiveness of β-cells and hyperglycemia following a glucose challenge. (A) Snapshots from live imaging of 4.5 dpf larvae expressing GCaMP6s and nuclear mCherry in the β-cells. The images show the GCaMP6s fluorescence before, during and after glucose stimulation. The larvae were mounted and imaged using a confocal microscope. The β-cells were stimulated with 12.5 mM glucose solution by intracardiac injection. (B) Traces of GCaMP6s fluorescence intensity over time for the islets shown in A. The islet of the WT larva showed a strong and coordinated increase in GCaMP6s fluorescence in response to glucose injection, indicating glucose-stimulated calcium influx, whereas the islet of the Tg(ins:il1b) larva did not respond to glucose. (C) Graph showing the GCaMP6s fluorescence-intensity fold change before and after the glucose injection. Tg(ins:il1b) β-cells showed a drastically reduced glucose-stimulated calcium influx compared to controls. Unpaired two-tailed t-test with Welch's correction, *P<0.05. n=5 larvae, mean±s.d. (D) A model showing the design of a glucose challenge in zebrafish larvae. The glucose challenge consists of incubating the larvae in three solutions: fish water (E3), 130 mM mannitol as an osmotic control, and 130 mM glucose. The larvae were incubated at 3 dpf and the glucose was measured at 5 dpf. (E) Plot showing glucose concentration following a glucose challenge in controls and Tg(ins:il1b) larvae. The Tg(ins:il1b) larvae show similar free glucose levels as WT larvae in fish water (E3) and mannitol. Following glucose challenge, the Tg(ins:il1b) larvae show an approximately 3.5-fold increase in free glucose compared to WT siblings. Two-way ANOVA with Sidak's multiple-comparison test; ****P<0.0001; each data point represents a pool of ten larvae; mean±s.d.