|
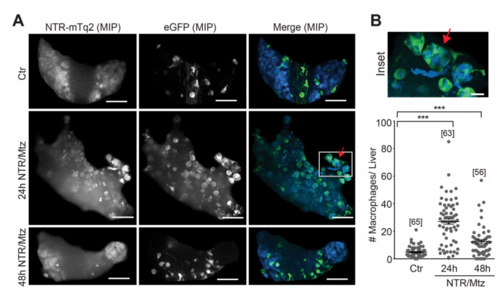
Macrophage recruitment after Mtz-induced liver damage. (A) Representative confocal maximum intensity projections (MIP) of zebrafish livers with fluorescent macrophages after indicated times of Mtz exposure in the mpeg1 macrophage reporter line. Red arrow, rounded hepatocyte appears to be engulfed by a macrophage. White box, marks the inset region. Scale bars, 50 μm. (B) Top: Magnification of marked region in A. Scale bar, 10 μm. Bottom: Number of macrophages in the liver at indicated times of Mtz exposure in the mpeg1macrophage reporter line. Square brackets, number of animals per condition. Error bars, SEM. ***t-test p < 0.0005.
|