
Fig. 5
- ID
- ZDB-FIG-190604-15
- Publication
- Anelli et al., 2018 - Ras-Induced miR-146a and 193a Target Jmjd6 to Regulate Melanoma Progression
- Other Figures
- All Figure Page
- Back to All Figure Page
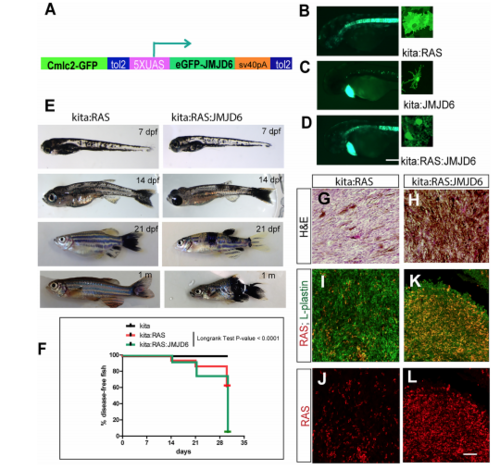
Expression of miR-resistant Jmjd6 promotes Ras-induced melanoma. (A) Schematic representation of the construct used to generate a transgenic line expressing microRNA-resistant Jmjd6 under the UAS promoter. Cmlc2-GFP is the cardiac myosin light chain promoter driving GFP expression in the heart as marker of transgenesis. (B–D) Examples of GFP staining in crosses between the UAS lines and the kita:Gal4 line (as indicated). Expression is visible in the notochord (Distel et al., 2009) and in melanocytes in all kita crosses (B–D), and in the heart for the UAS:Jmjd6 line, C,D) GFP is localized to the nucleus for Jmjd6-GFP or the plasma membrane for eGFP-HRASV12. (E) Double or triple transgenic larvae and juveniles at the indicated stages of development. (F) Disease- free survival curve of the double or triple transgenic fish. N = 100 for kita; 321 for kita:Ras; 211 for kita:Ras:Jmjd6. Long-rank test: p-value < 0,0001. (G,H) H&E staining of representative melanoma sections from transgenic fish as indicated. (I–L) Immunostaining for L-plastin (red florescence) and GFP (only in I–K, indicating HRASV12, green fluorescence) in representative melanoma sections from transgenic fish as indicated. Calibration bar: 100 μm for (B,D), 50 μm for (I–L). |
| Fish: | |
|---|---|
| Observed In: | |
| Stage Range: | Days 14-20 to Days 30-44 |