
Fig. 5
- ID
- ZDB-FIG-190530-22
- Publication
- Olstad et al., 2018 - Ciliary Beating Compartmentalizes Cerebrospinal Fluid Flow in the Brain and Regulates Ventricular Development
- Other Figures
- All Figure Page
- Back to All Figure Page
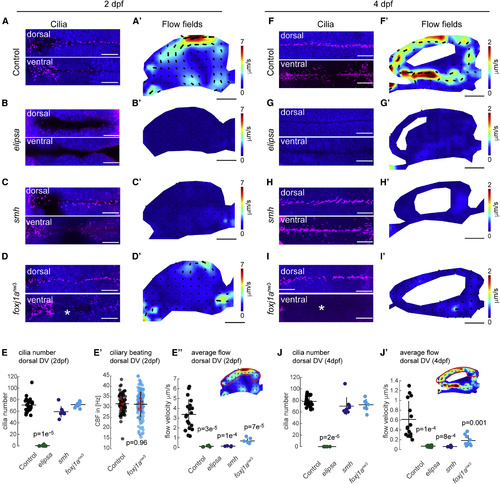
The Directional CSF Flow near the Diencephalic Ventricular Wall Is Generated by Motile Ciliary Beating In order to establish the causal link between ciliary beating and the directional CSF flow near the ventricular walls, we analyzed different mutants with ciliary defects. (A–J) For each mutant line, cilia were labeled by glutamylated tubulin staining (magenta, DAPI in blue) at 2 (A: nctrl, 2 dpf = 21; B: nelipsa, 2 dpf = 8; C: nsmh, 2 dpf = 8; D: nfoxj1anw3, 2 dpf = 8) and 4 dpf (F: nctrl, 4 dpf = 20; G: nelipsa, 4 dpf = 8 ; H: nsmh, 4 dpf = 9; I: nfoxj1anw3, 4 dpf = 8) and counted at 2 (E) and 4 (J) dpf. (A’–J’) The directional CSF flow in the diencephalic ventricle (DV) of each mutant line was measured by confocal imaging of fluorescent beads, analyzed by PIV, compared to controls at 2 (A’: nctrl, 2 dpf = 12, B’: nelipsa, 2 dpf = 6, C’: nsmh, 2 dpf = 8, D’: nfoxj1anw3, 2 dpf = 8) and 4 dpf (F’: nctrl, 4 dpf = 14, G’: nelipsa, 4 dpf = 7, H’: nsmh, 4 dpf = 11, I’: nfoxj1anw3, 4 dpf = 7) and quantified at 2 (E’’) and 4 dpf (J’). (B and G) Elipsa mutants lack all primary and motile cilia, as demonstrated by the absence of glutamylated tubulin staining in a dorsal and ventral section of the diencephalon at 2 dpf (B, quantified in E) and 4 dpf (G, quantified in J). As a result, the directional CSF flow was absent in the diencephalic ventricle of elipsa at 2 (B’, quantified in E’) and 4 dpf (G’, quantified in J’). (C and H) The cilia mutant smh shows no significant difference in the number of cilia at 2 dpf (C, quantified in E) and 4 dpf (H, quantified in J), but the directional CSF flow was abolished (C’, H’, E’’, and J’). (D and I) In the cilia mutant foxj1anw3, the number of cilia along the ventral midline of the DV was reduced (indicated by ∗) at 2 dpf (D) and 4 dpf (I), but not along the dorsal DV (E and J). The difference in cilia number along the ventral DV is more apparent at 4 dpf (I) than at 2 dpf (D). The beating frequency of the cilia in the dorsal DV was not significantly different from controls at 2 dpf when comparing mean of individual larvae (indicated by a red cross); p value was calculated by the Wilcoxon rank-sum test (nctrl = 7, nfoxj1anw3 = 14; E’). The directionality of the CSF flow in foxj1anw3 was similar to controls, yet the velocity was reduced (D’, E’’, I’, and J’). (E and J) Quantification of the cilia number along the dorsal DV at 2 (E) and 4 dpf (J). (E’’ and J’) Quantification of the flow velocity along the dorsal DV at 2 (E’’) and 4 dpf (J’), as indicated in the inset for a control example. All controls from the various mutant clutches are pooled. Horizontal lines indicate the mean of the respective sample groups; vertical lines represent the mean ± SD. All p values were calculated with a Kruskal-Wallis (E and J) or one-way ANOVA (E’’ and J’) test followed by pairwise comparisons. Scale bars are 50 μm (flow fields) or 25 μm (stainings). White areas in flow fields were not included in the PIV analysis, due to the presence of brain tissue and absence of particles. See also Figure S6 and Video S5. |
| Fish: | |
|---|---|
| Observed In: | |
| Stage Range: | Long-pec to Day 4 |