
Fig. 4
- ID
- ZDB-FIG-190403-2
- Publication
- Lukoseviciute et al., 2018 - From Pioneer to Repressor: Bimodal foxd3 Activity Dynamically Remodels Neural Crest Regulatory Landscape In Vivo
- Other Figures
- All Figure Page
- Back to All Figure Page
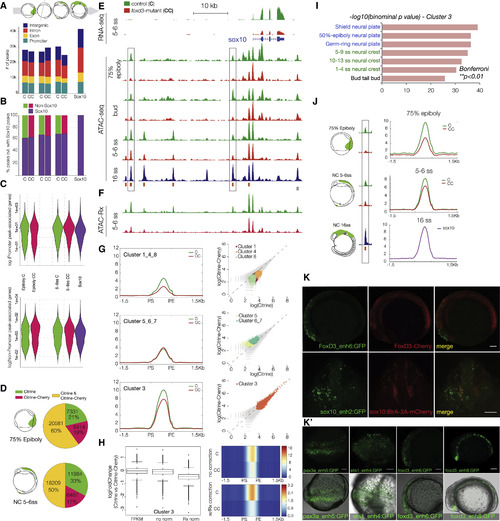
Epigenomic Profiling of Chromatin Accessibility in foxd3 Mutant NC across Developmental Time (A and B) (A) Stacked bar plots depicting genomic annotation of ATAC-seq peaks across stages analyzed (75% epiboly; bud stage; 5–6ss and 14–16ss) and (B) quantification of open elements at earlier stages as a proportion of accessible elements detected in migrating/differentiating NC. (C) Violin plots correlating putative promoter and cis-regulatory elements with gene expression levels. Bimodal distribution of gene expression is associated with putative enhancers at all stages, but with promoters only at epiboly. (D) Pie charts comparing Citrine-only, Cherry-only, and Citrine/Cherry peak number proportions of ATAC-peaks. (E) Genome browser screenshot showing RNA-seq and ATAC-seq profiles in foxd3 mutant (red) and foxd3-control cells (green) within sox10 locus. (F) Tracks showing normalized ATAC-Rx profiles obtained using reference exogenous Drosophila epigenome. (G) Mean density maps of merged profiles and corresponding scatterplots of raw counts for k-means clusters featuring elements with differential accessibility and signal levels in foxd3-mutant and controls at 5–6ss. (H) Boxplots and heatmap (raw read counts) showing fold change in accessibility and comparing ATAC signal levels between control (C) and mutants (CC) k-cluster 3 elements with and without Rx normalization. (I) Bar chart depicting functional annotation of k-cluster 3 shows enrichment in zebrafish gene expression ontology terms linked to NC and neural plate development (Bonferroni; ∗∗p < 0.01). For further analysis of k-cluster, see Figure S4. (J) Merged profiles for 3,565 elements open at 75% epiboly showed more prominent accessibility defect than at 5–6ss (C ≫ CC, > 50%), suggesting biological compensation over time. (K and K′) Cis-regulatory elements from k-cluster 3 show NC-specific reporter activity. (K) Lateral and frontal view of embryos injected with foxd3-enh6 and sox10-enh2 GFP reporter constructs into the genetic background of foxd3-Cherry and sox10:BirA-2A-Cherry, respectively. Scale bars correspond to 100 μm. (K′) Fluorescent and bright-field overlay images of pax3a and ets1(dorsal view) and foxd3 (lateral view) enhancers. Scale bars correspond to 100 μm. |
Reprinted from Developmental Cell, 47, Lukoseviciute, M., Gavriouchkina, D., Williams, R.M., Hochgreb-Hagele, T., Senanayake, U., Chong-Morrison, V., Thongjuea, S., Repapi, E., Mead, A., Sauka-Spengler, T., From Pioneer to Repressor: Bimodal foxd3 Activity Dynamically Remodels Neural Crest Regulatory Landscape In Vivo, 608-628.e6, Copyright (2018) with permission from Elsevier. Full text @ Dev. Cell