
Fig. 6
- ID
- ZDB-FIG-190328-8
- Publication
- Cao et al., 2018 - Regional Gene Expression Profile Comparison Reveals the Unique Transcriptome of the Optic Fissure
- Other Figures
- All Figure Page
- Back to All Figure Page
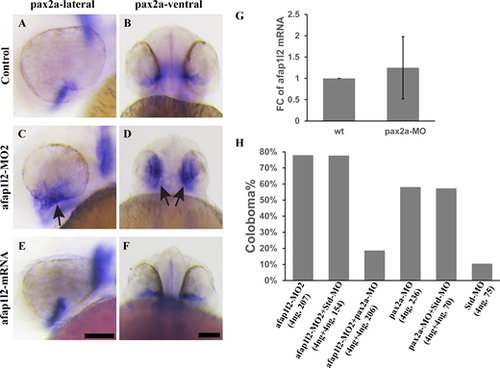
afap1l2 controls OF closure by regulating pax2a expression. (A–F) ISH of pax2a in the eyes of control, afap1l2-morphant, and afap1l2-overexpressing zebrafish at 36 hpf. (A, B) Lateral views; (C, D) ventral views. (G) qPCR comparison of afap1l2 expression levels in the eyes of wild-type and pax2a-morphant zebrafish. FC: fold change. (H) Quantification of incidences of coloboma phenotype of afap1l2-MO and pax2a-MO coinjection. Numbers in parentheses denote dosage of the morpholinos used and the number of zebrafish injected. The scale bars in (E, F) are both 100 μm, and they apply to (A, C, E) and to (B, D, F), respectively. |
| Genes: | |
|---|---|
| Fish: | |
| Knockdown Reagents: | |
| Anatomical Terms: | |
| Stage: | Prim-25 |
| Fish: | |
|---|---|
| Knockdown Reagents: | |
| Observed In: | |
| Stage Range: | Prim-25 to Protruding-mouth |