
Fig. 2
- ID
- ZDB-FIG-181207-8
- Publication
- Kirchgeorg et al., 2018 - Cre/lox-controlled spatio-temporal perturbation of FGF signaling in zebrafish
- Other Figures
- All Figure Page
- Back to All Figure Page
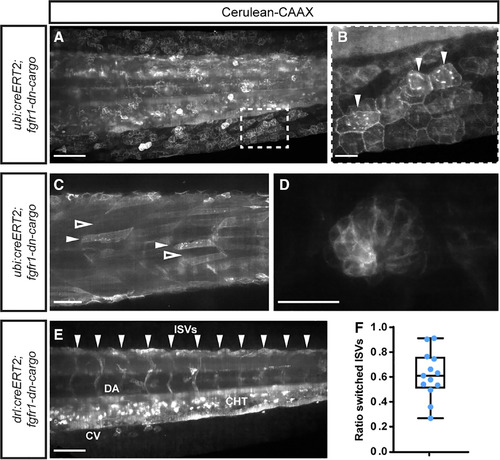
Recombination efficiency of fgfr1‐dn‐cargo. A–F: SPIM imaging of 3‐dpf ubi:creERT2;fgfr‐dn‐cargo embryos, 4‐OHT induced at shield stage and heatshocked at 3 dpf shortly before imaging; signal shows Cerulean‐CAAX fluorescence of the fgfr1‐dn‐cargo transgene upon successful loxP recombination. A,B: Lateral view of tail, showing the spectrum of Cerulean‐CAAX–expressing clones, with hatched outline magnified (B) to document the Cerulean‐CAAX signaling confines to membranes and perinuclear ER (arrowheads) of successfully recombined cells. C,D: Examples for recombination efficiency in ubi:creERT2;fgfr‐dn‐cargo embryos with Cerulean‐CAAX–positive and –negative clones, including somitic muscle fibers (C, white arrowhead for positive fibers, black arrowhead for negative fibers) and a lateral‐line neuromast (D). E,F: Quantification of recombination efficiency using Cerulean‐CAAX lineage labeling in intersomitic vessels (ISVs) in drl:creERT2;fgfr‐dn‐cargo embryos following 4‐OHT treatment at shield stage and heatshock at 3 dpf. E: Cerulean‐CAAX fluorescence was counted in ISVs (arrowheads indicating positions), unilateral or bilateral signal counted as positive labeling. F: Ratio of labeled vs. total ISV spaces as proxy for recombination efficiency (n = 13); box depicts standard deviation, bars the maximum spread. Scale bars A,C,E = 100 µm. Scale bars B,D = 20 µm. |