
Fig. 6
- ID
- ZDB-FIG-181207-6
- Publication
- Tanvir et al., 2018 - One month of hyperglycemia alters spectral responses of the zebrafish photopic ERG
- Other Figures
- All Figure Page
- Back to All Figure Page
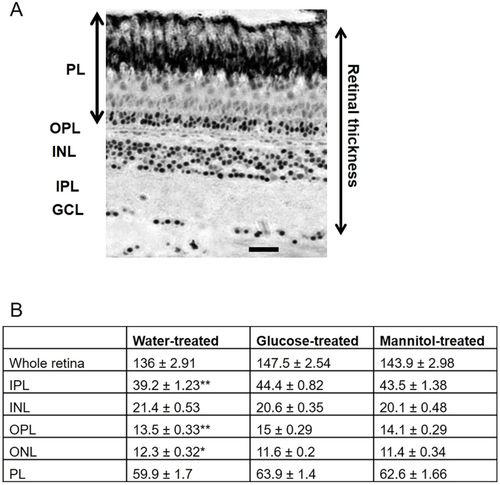
Mean thickness measurements (±s.e.m.) of retinal layers from tissue exposed to alternating water, glucose or mannitol for 4 weeks. (A) Representative retinal thick section with retinal layers labeled on the left. Measurements were made of each layer from the ganglion cell layer (GCL) to the distal edge of the photoreceptor layer (PL). INL, inner nuclear layer; IPL, inner plexiform layer; OPL, outer plexiform layer. Scale bar: 20 μm. (B) Significant differences were observed for the IPL (P=0.008), OPL (P=0.005) and outer nuclear layer (ONL) (P=0.048) measurements only. In these cases, changes in layer thickness were observed in water-treated, compared with glucose- and mannitol-treated, tissue; however, no differences were observed between glucose- and mannitol-treated animals (*P≤0.05, **P≤0.01). Units are μm. n=7 eyes (water), n=10 eyes (glucose), and n=7 eyes (mannitol). |
| Fish: | |
|---|---|
| Condition: | |
| Observed In: | |
| Stage: | Adult |