
Fig. 5
- ID
- ZDB-FIG-181116-55
- Publication
- Walton et al., 2018 - Cyclopropane Modification of Trehalose Dimycolate Drives Granuloma Angiogenesis and Mycobacterial Growth through Vegf Signaling
- Other Figures
- All Figure Page
- Back to All Figure Page
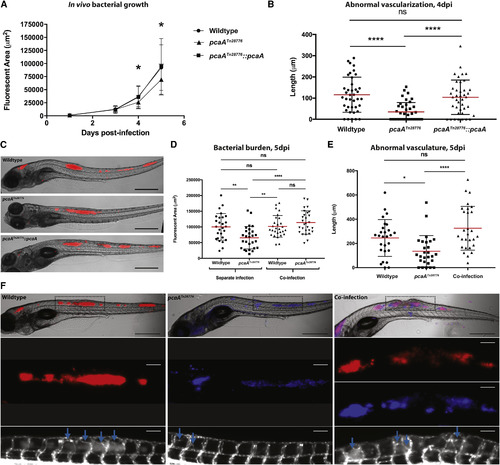
pcaA Mutant Bacteria Exhibit In vivo Growth Defects Coinciding with Onset of Granuloma Angiogenesis (A) Five-day time course of larvae infected with wild-type, pcaA mutant, or complemented mutant M. marinum strains. Bacterial burdens were measured at 1, 3, 4, and 5 dpi. At 4 dpi pcaA mutants exhibit a reduced growth rate, which persists through 5 dpi. The complemented mutant strain exhibits wild-type levels of growth throughout. Representative of three independent experiments. ∗p < 0.05; one-way ANOVA with Dunnett's multiple comparison post-test. n = 40 for each group. (B) Quantification of abnormal vascularization. The timing of the growth defect correlates with the onset of robust vascularization for wild-type and complemented strain infections but a failure to extensively vascularize infection foci for pcaA mutant strain infections. ∗∗∗∗p < 0.0001; one-way ANOVA with Tukey's multiple comparison post-test. n = 40 for each group. (C) Representative images of larvae at 5 dpi infected with each of the M. marinum strains. Wild-type, upper panel; pcaA mutant, middle; complemented mutant, lower. Scale bars, 500 μm. (D–F) Larvae possessing the Tg(kdrl:EGFP) transgene were co-infected with wild-type and PcaA mutant M. marinum. Bacterial burden (D) and length of abnormal vasculature (E) were quantified for each larva at 5 dpi. ∗p < 0.05; ∗∗p < 0.01; ∗∗∗∗p < 0.0001; one-way ANOVA with Tukey's multiple comparison post-test. Data shown represent an aggregate of two independent experiments. n = 27 for wild-type infections alone; n = 27 for pcaA mutant infections alone; n = 28 for co-infection. (F) Representative images of each infection. Upper panels: merge of bright-field and fluorescent channels. Red depicts wild-type M. marinum; blue depicts pcaA mutant M. marinum; purple depicts co-localization between the two strains. Dotted lines denote the area shown in lower panels. Scale bars, 500 μm. Middle panels: fluorescent channels alone, showing infection burden. Lower panels: vasculature. Blue arrows denote intersegmental vessel growth characteristic of granuloma angiogenesis. Scale bars, 100 μm. |