Fig. 3
- ID
- ZDB-FIG-181019-57
- Publication
- Molinari et al., 2018 - Using zebrafish to study the function of nephronophthisis and related ciliopathy genes
- Other Figures
- All Figure Page
- Back to All Figure Page
|
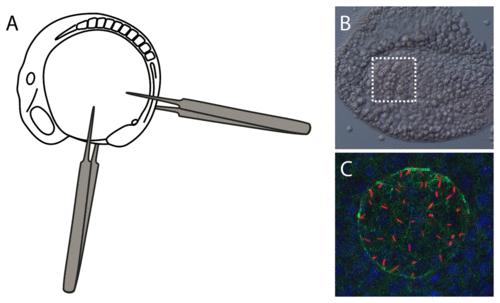
Mounting samples for visualization of Kupffer’s vesicle. Schematic showing a 10 somite stage zebrafish embryo (A). Forceps can be used as depicted to separate the tail tip from the rest of the embryo. Excess yolk is then removed, and the tail tip mounted flat on to a microscope slide. (B) Bright field image overlaid with fluorescence image of flat-mounted tail tip. The white box depicts the location of Kupffer’s vesicle. Fluorescence from acetylated-α tubulin (red) can be seen within this region. (C) Confocal image of Kupffer’s vesicle, visualised using acetylated-α tubulin (red), aPKC (green) and DAPI (blue). |

