
Fig. 3
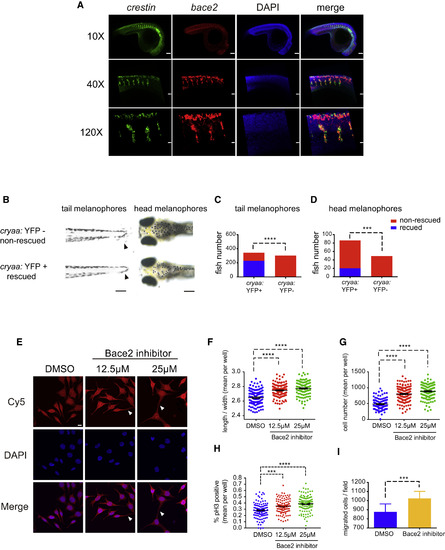
Bace2 Acts Cell Intrinsically within the Melanophore Lineage (A) At 24 hpf in WT embryos, double-fluorescent ISH against the pan neural crest marker crestin (green) and bace2 (red) shows bace2 expression overlaps with crestin, suggesting bace2 is highly enriched in the neural crest lineage from which the melanophores are derived. (B–D) Melanophore-specific transgenic rescue of the bace2−/− mutant. A stable transgenic line was created in which the dct promoter drives Bace2 in the melanophores (along with a cryaa: yellow fluorescent protein (YFP) transgene marker). Founders were identified by expression of the YFP marker in the eye. Founders were crossed into other uninjected bace2−/− adults to generate F1 embryos. F1 embryos were scored for dendritic tail melanophore rescue at 3 dpf (B, arrowhead) or for rescue of the head melanophores at 5 dpf. F1 embryos were divided into four groups: rescued, non-rescued, YFP positive, and YFP negative. Chi-square with Yate's correction was performed to associate rescue phenotype with YFP-positive eye (quantified in C and D). ∗∗∗p < 0.001, ∗∗∗∗p < 0.0001. (E–G) The zebrafish melanoma cell line ZMEL1 was treated with 12.5 μM or 25 μM of the Bace2 inhibitor PF-06663195 for 72 hr, and resulted in hyperdendritic cells (arrowhead) similar to what was seen in vivo. A representative field of cells is shown in (E) and dendricity is quantified as an increase in cell length to width ratio (F), along with an increase in overall cell number (G). Data are from three independent experiments, one-way ANOVA followed by Holm-Sidak's multiple comparisons test, ∗∗∗∗p < 0.0001. (H) The increased cell number induced by Bace2 inhibitor is due to increased ZMEL1 cell proliferation, as measured by increased phospho-histone H3 (pH3) immunostaining. Data are from three independent experiments, one-way ANOVA followed by Holm-Sidak's multiple comparisons test, ∗∗∗p < 0.001, ∗∗∗∗p < 0.0001. (I) ZMEL1 treated with 25 μM of the Bace2 inhibitor PF-06663195 for 48 hr have increased migration in Transwell assay. Data are from five independent experiments, two-tailed t test, ∗∗∗p < 0.001. All bar graphs are presented as means ± SEM. Scale bars: (A 120× and E) 10 μm; (A 40×) 30 μm, (A 10× and B, left) 100 μm, and (B, right) 200 μm. |
| Genes: | |
|---|---|
| Fish: | |
| Anatomical Term: | |
| Stage: | Prim-5 |
| Fish: | |
|---|---|
| Observed In: | |
| Stage: | Protruding-mouth |
Reprinted from Developmental Cell, 45(5), Zhang, Y.M., Zimmer, M.A., Guardia, T., Callahan, S.J., Mondal, C., Di Martino, J., Takagi, T., Fennell, M., Garippa, R., Campbell, N.R., Bravo-Cordero, J.J., White, R.M., Distant Insulin Signaling Regulates Vertebrate Pigmentation through the Sheddase Bace2, 580-594.e7, Copyright (2018) with permission from Elsevier. Full text @ Dev. Cell